| Multiple Linear Regression - Estimated Regression Equation |
| Y(t)[t] = + 22.2014493267714 + 1.47305280975136`Y(t-1)`[t] -0.609958903931009`Y(t-2)`[t] -0.311570948737318`Y(t-3)`[t] + 0.266930877605454`Y(t-4)`[t] + 1.67219763575734X[t] -2.25507346474391M1[t] + 0.6140703509069M2[t] -2.28209966022831M3[t] + 6.09052972606484M4[t] -0.631935182812322M5[t] + 4.54801419086582M6[t] -6.35229584801417M7[t] + 1.40352294946333M8[t] + 0.884830647112344M9[t] + 4.65001216934383M10[t] + 0.985345882304379M11[t] + 0.0152649517802632t + e[t] |
| Multiple Linear Regression - Ordinary Least Squares | |||||
| Variable | Parameter | S.D. | T-STAT H0: parameter = 0 | 2-tail p-value | 1-tail p-value |
| (Intercept) | 22.2014493267714 | 11.532871 | 1.9251 | 0.061732 | 0.030866 |
| `Y(t-1)` | 1.47305280975136 | 0.158174 | 9.3129 | 0 | 0 |
| `Y(t-2)` | -0.609958903931009 | 0.280548 | -2.1742 | 0.035988 | 0.017994 |
| `Y(t-3)` | -0.311570948737318 | 0.286298 | -1.0883 | 0.283328 | 0.141664 |
| `Y(t-4)` | 0.266930877605454 | 0.163244 | 1.6352 | 0.110272 | 0.055136 |
| X | 1.67219763575734 | 1.598698 | 1.046 | 0.302181 | 0.15109 |
| M1 | -2.25507346474391 | 2.113838 | -1.0668 | 0.292787 | 0.146393 |
| M2 | 0.6140703509069 | 2.264139 | 0.2712 | 0.787693 | 0.393846 |
| M3 | -2.28209966022831 | 2.440303 | -0.9352 | 0.355606 | 0.177803 |
| M4 | 6.09052972606484 | 2.251047 | 2.7056 | 0.01015 | 0.005075 |
| M5 | -0.631935182812322 | 2.482619 | -0.2545 | 0.800448 | 0.400224 |
| M6 | 4.54801419086582 | 1.940873 | 2.3433 | 0.024449 | 0.012225 |
| M7 | -6.35229584801417 | 2.327005 | -2.7298 | 0.00955 | 0.004775 |
| M8 | 1.40352294946333 | 2.332968 | 0.6016 | 0.55101 | 0.275505 |
| M9 | 0.884830647112344 | 2.975698 | 0.2974 | 0.767817 | 0.383909 |
| M10 | 4.65001216934383 | 2.139782 | 2.1731 | 0.036073 | 0.018036 |
| M11 | 0.985345882304379 | 2.324637 | 0.4239 | 0.67405 | 0.337025 |
| t | 0.0152649517802632 | 0.03359 | 0.4544 | 0.652091 | 0.326046 |
| Multiple Linear Regression - Regression Statistics | |
| Multiple R | 0.965438204984186 |
| R-squared | 0.932070927643088 |
| Adjusted R-squared | 0.901681605799206 |
| F-TEST (value) | 30.6710012296883 |
| F-TEST (DF numerator) | 17 |
| F-TEST (DF denominator) | 38 |
| p-value | 0 |
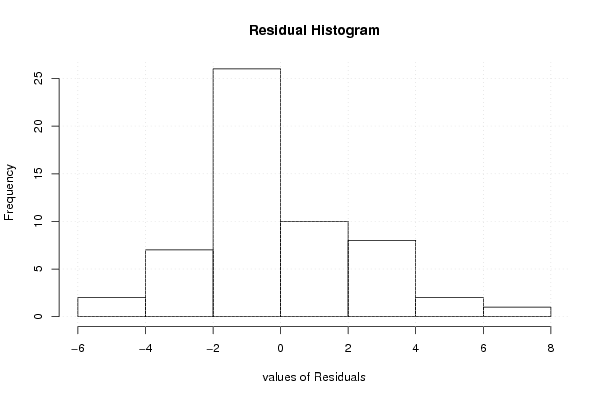
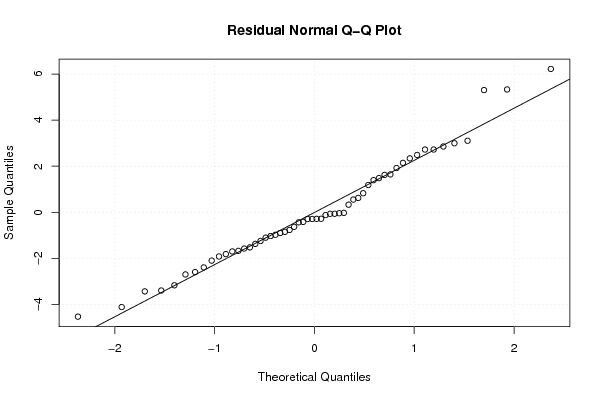
| Multiple Linear Regression - Residual Statistics | |
| Residual Standard Deviation | 2.77038156067033 |
| Sum Squared Residuals | 291.650531684682 |
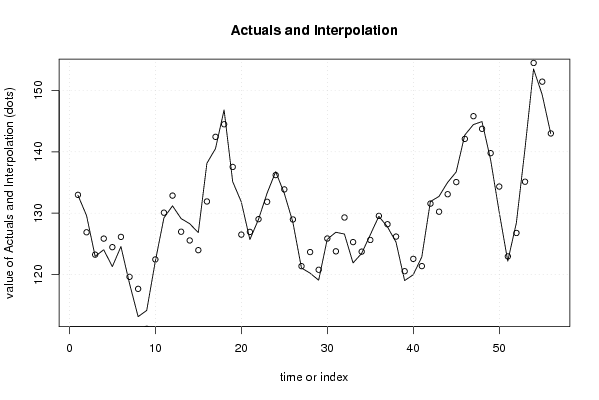
| Multiple Linear Regression - Actuals, Interpolation, and Residuals | |||
| Time or Index | Actuals | Interpolation Forecast | Residuals Prediction Error |
| 1 | 132.92 | 132.983760318567 | -0.0637603185665924 |
| 2 | 129.61 | 126.886235326489 | 2.72376467351121 |
| 3 | 122.96 | 123.241262021469 | -0.281262021469456 |
| 4 | 124.04 | 125.855966646979 | -1.81596664697931 |
| 5 | 121.29 | 124.460504182536 | -3.17050418253571 |
| 6 | 124.56 | 126.134473269161 | -1.57447326916149 |
| 7 | 118.53 | 119.632110895046 | -1.10211089504641 |
| 8 | 113.14 | 117.671226042491 | -4.53122604249057 |
| 9 | 114.15 | 111.153199322278 | 2.99680067772204 |
| 10 | 122.17 | 122.460744416983 | -0.290744416982594 |
| 11 | 129.23 | 130.078942344692 | -0.848942344692285 |
| 12 | 131.19 | 132.863299752968 | -1.67329975296797 |
| 13 | 129.12 | 126.975166062872 | 2.14483393712770 |
| 14 | 128.28 | 125.555930802724 | 2.72406919727643 |
| 15 | 126.83 | 123.974129250684 | 2.85587074931597 |
| 16 | 138.13 | 131.906598877913 | 6.22340112208706 |
| 17 | 140.52 | 142.438508762002 | -1.91850876200246 |
| 18 | 146.83 | 144.489339626827 | 2.34066037317325 |
| 19 | 135.14 | 137.533654495603 | -2.39365449560344 |
| 20 | 131.84 | 126.507574564522 | 5.33242543547753 |
| 21 | 125.7 | 126.945444639670 | -1.24544463967037 |
| 22 | 128.98 | 129.020809473211 | -0.0408094732107547 |
| 23 | 133.25 | 131.855931195698 | 1.39406880430221 |
| 24 | 136.76 | 136.207294287067 | 0.552705712932555 |
| 25 | 133.24 | 133.872468316190 | -0.632468316189744 |
| 26 | 128.54 | 128.975900767936 | -0.435900767935761 |
| 27 | 121.08 | 121.364883661894 | -0.284883661893834 |
| 28 | 120.23 | 123.664268007648 | -3.43426800764833 |
| 29 | 119.08 | 120.780053355482 | -1.70005335548232 |
| 30 | 125.75 | 125.869466170903 | -0.119466170902747 |
| 31 | 126.89 | 123.784667023855 | 3.10533297614469 |
| 32 | 126.6 | 129.298020432093 | -2.69802043209308 |
| 33 | 121.89 | 125.286905878889 | -3.39690587888891 |
| 34 | 123.44 | 123.731399773180 | -0.291399773179585 |
| 35 | 126.46 | 125.632793506154 | 0.827206493845888 |
| 36 | 129.49 | 129.555984974033 | -0.0659849740332081 |
| 37 | 127.78 | 128.19727118068 | -0.417271180680044 |
| 38 | 125.29 | 126.187382759627 | -0.897382759627055 |
| 39 | 119.02 | 120.543677205408 | -1.52367720540766 |
| 40 | 119.96 | 122.555914978614 | -2.59591497861357 |
| 41 | 122.86 | 121.377186851981 | 1.48281314801903 |
| 42 | 131.89 | 131.559784919369 | 0.330215080631395 |
| 43 | 132.73 | 130.240992588524 | 2.48900741147555 |
| 44 | 135.01 | 133.088871069087 | 1.92112893091275 |
| 45 | 136.71 | 135.064450159163 | 1.64554984083724 |
| 46 | 142.73 | 142.107046336627 | 0.622953663372934 |
| 47 | 144.43 | 145.802332953456 | -1.37233295345582 |
| 48 | 144.93 | 143.743420985931 | 1.18657901406863 |
| 49 | 138.75 | 139.781334121691 | -1.03133412169131 |
| 50 | 130.22 | 134.334550343225 | -4.11455034322483 |
| 51 | 122.19 | 122.956047860545 | -0.766047860545026 |
| 52 | 128.4 | 126.777251488846 | 1.62274851115415 |
| 53 | 140.43 | 135.123746847999 | 5.30625315200145 |
| 54 | 153.5 | 154.476936013740 | -0.976936013740409 |
| 55 | 149.33 | 151.428574996970 | -2.09857499697038 |
| 56 | 142.97 | 142.994307891807 | -0.0243078918066325 |
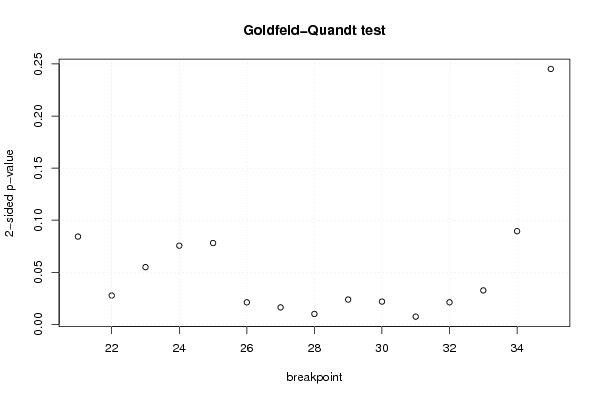
| Goldfeld-Quandt test for Heteroskedasticity | |||
| p-values | Alternative Hypothesis | ||
| breakpoint index | greater | 2-sided | less |
| 21 | 0.957840773850388 | 0.0843184522992245 | 0.0421592261496122 |
| 22 | 0.986115019874089 | 0.0277699602518228 | 0.0138849801259114 |
| 23 | 0.972503532706071 | 0.0549929345878572 | 0.0274964672939286 |
| 24 | 0.962207716395179 | 0.0755845672096422 | 0.0377922836048211 |
| 25 | 0.960933915942092 | 0.0781321681158157 | 0.0390660840579078 |
| 26 | 0.989374312215197 | 0.0212513755696055 | 0.0106256877848027 |
| 27 | 0.991796395572788 | 0.0164072088544238 | 0.0082036044272119 |
| 28 | 0.994947544198604 | 0.0101049116027912 | 0.00505245580139561 |
| 29 | 0.988049198797882 | 0.0239016024042354 | 0.0119508012021177 |
| 30 | 0.989021977097648 | 0.0219560458047032 | 0.0109780229023516 |
| 31 | 0.996249017070732 | 0.00750196585853604 | 0.00375098292926802 |
| 32 | 0.989360876457439 | 0.0212782470851227 | 0.0106391235425614 |
| 33 | 0.983653617108173 | 0.0326927657836544 | 0.0163463828918272 |
| 34 | 0.955235626064056 | 0.0895287478718877 | 0.0447643739359439 |
| 35 | 0.877423559271052 | 0.245152881457897 | 0.122576440728948 |
| Meta Analysis of Goldfeld-Quandt test for Heteroskedasticity | |||
| Description | # significant tests | % significant tests | OK/NOK |
| 1% type I error level | 1 | 0.0666666666666667 | NOK |
| 5% type I error level | 9 | 0.6 | NOK |
| 10% type I error level | 14 | 0.933333333333333 | NOK |