| Multiple Linear Regression - Estimated Regression Equation |
| X[t] = -999.997265120483 + 0.564526605850022Y[t] -0.0123080270622791`Yt-1`[t] + 0.029081352446026`Yt-2`[t] -0.0827779579897504`Yt-3`[t] -0.0652551152233573`Yt-4 `[t] -87.0424548307653M1[t] -1.31472901234750M2[t] -35.8724720751150M3[t] -180.493075859543M4[t] -233.770413585435M5[t] -241.721782476039M6[t] -240.130841473458M7[t] -210.279668566981M8[t] -103.591023428529M9[t] -107.571987999933M10[t] -139.295890813598M11[t] -9.13867789192095t + e[t] |
| Multiple Linear Regression - Ordinary Least Squares | |||||
| Variable | Parameter | S.D. | T-STAT H0: parameter = 0 | 2-tail p-value | 1-tail p-value |
| (Intercept) | -999.997265120483 | 287.492303 | -3.4783 | 0.001281 | 0.000641 |
| Y | 0.564526605850022 | 0.085075 | 6.6356 | 0 | 0 |
| `Yt-1` | -0.0123080270622791 | 0.134495 | -0.0915 | 0.927566 | 0.463783 |
| `Yt-2` | 0.029081352446026 | 0.136414 | 0.2132 | 0.832322 | 0.416161 |
| `Yt-3` | -0.0827779579897504 | 0.135677 | -0.6101 | 0.54542 | 0.27271 |
| `Yt-4 ` | -0.0652551152233573 | 0.088219 | -0.7397 | 0.464029 | 0.232014 |
| M1 | -87.0424548307653 | 166.077139 | -0.5241 | 0.603247 | 0.301623 |
| M2 | -1.31472901234750 | 165.272061 | -0.008 | 0.993695 | 0.496847 |
| M3 | -35.8724720751150 | 167.817992 | -0.2138 | 0.831878 | 0.415939 |
| M4 | -180.493075859543 | 163.893165 | -1.1013 | 0.2777 | 0.13885 |
| M5 | -233.770413585435 | 162.897906 | -1.4351 | 0.159446 | 0.079723 |
| M6 | -241.721782476039 | 172.246312 | -1.4033 | 0.168632 | 0.084316 |
| M7 | -240.130841473458 | 169.612838 | -1.4158 | 0.164991 | 0.082495 |
| M8 | -210.279668566981 | 161.063394 | -1.3056 | 0.199548 | 0.099774 |
| M9 | -103.591023428529 | 168.786037 | -0.6137 | 0.543043 | 0.271521 |
| M10 | -107.571987999933 | 174.960958 | -0.6148 | 0.542329 | 0.271164 |
| M11 | -139.295890813598 | 174.583954 | -0.7979 | 0.429902 | 0.214951 |
| t | -9.13867789192095 | 2.1489 | -4.2527 | 0.000132 | 6.6e-05 |
| Multiple Linear Regression - Regression Statistics | |
| Multiple R | 0.974162571371517 |
| R-squared | 0.948992715461167 |
| Adjusted R-squared | 0.926173667114847 |
| F-TEST (value) | 41.587742882985 |
| F-TEST (DF numerator) | 17 |
| F-TEST (DF denominator) | 38 |
| p-value | 0 |
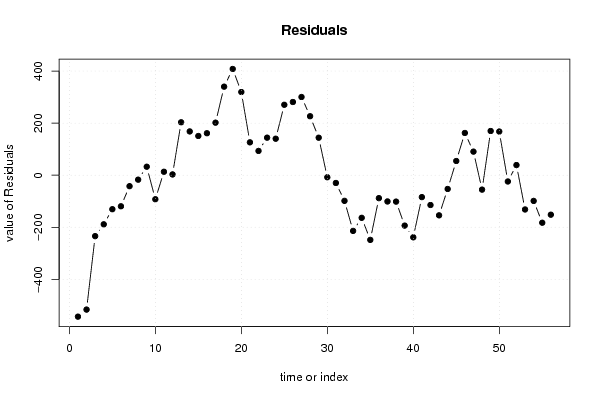
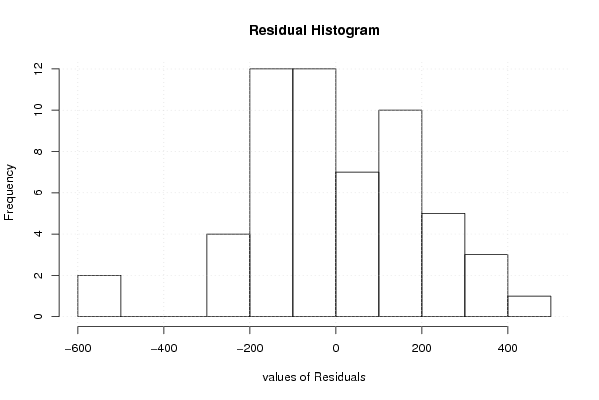
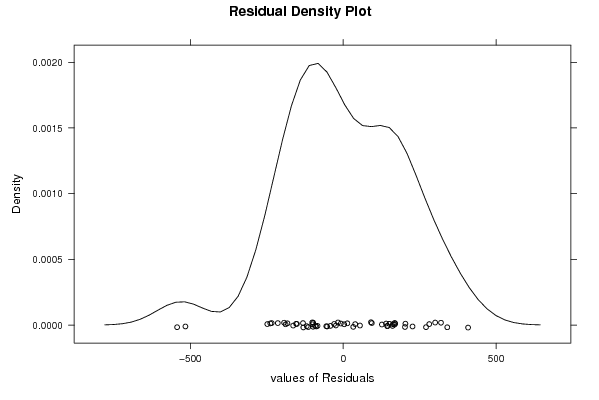
| Multiple Linear Regression - Residual Statistics | |
| Residual Standard Deviation | 235.970880547297 |
| Sum Squared Residuals | 2115925.74571814 |
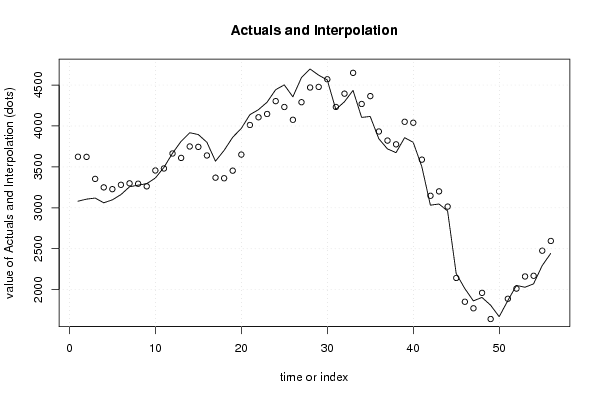
| Multiple Linear Regression - Actuals, Interpolation, and Residuals | |||
| Time or Index | Actuals | Interpolation Forecast | Residuals Prediction Error |
| 1 | 3080.58 | 3623.83751418869 | -543.257514188694 |
| 2 | 3106.22 | 3622.29180866268 | -516.071808662677 |
| 3 | 3119.31 | 3353.30376157706 | -233.993761577058 |
| 4 | 3061.26 | 3249.78257227101 | -188.522572271015 |
| 5 | 3097.31 | 3227.83206474094 | -130.522064740940 |
| 6 | 3161.69 | 3281.0285179707 | -119.338517970700 |
| 7 | 3257.16 | 3299.20770147416 | -42.0477014741554 |
| 8 | 3277.01 | 3294.05765006429 | -17.0476500642849 |
| 9 | 3295.32 | 3262.57702666131 | 32.7429733386929 |
| 10 | 3363.99 | 3456.22486454377 | -92.2348645437679 |
| 11 | 3494.17 | 3480.79342818412 | 13.3765718158770 |
| 12 | 3667.03 | 3663.97877724408 | 3.05122275591673 |
| 13 | 3813.06 | 3609.70970720247 | 203.350292797532 |
| 14 | 3917.96 | 3749.69142689593 | 168.268573104068 |
| 15 | 3895.51 | 3744.63026210132 | 150.879737898676 |
| 16 | 3801.06 | 3639.76381059348 | 161.296189406521 |
| 17 | 3570.12 | 3368.20304435369 | 201.916955646312 |
| 18 | 3701.61 | 3361.34950360229 | 340.260496397713 |
| 19 | 3862.27 | 3453.98832038432 | 408.281679615683 |
| 20 | 3970.1 | 3650.39670002811 | 319.703299971888 |
| 21 | 4138.52 | 4012.13721347969 | 126.382786520313 |
| 22 | 4199.75 | 4106.31722154596 | 93.4327784540413 |
| 23 | 4290.89 | 4146.6149129186 | 144.2750870814 |
| 24 | 4443.91 | 4303.64195720389 | 140.268042796114 |
| 25 | 4502.64 | 4231.93219609917 | 270.707803900827 |
| 26 | 4356.98 | 4075.67967124113 | 281.300328758866 |
| 27 | 4591.27 | 4290.65453251765 | 300.61546748235 |
| 28 | 4696.96 | 4470.31909946695 | 226.640900533054 |
| 29 | 4621.4 | 4477.21920043068 | 144.180799569318 |
| 30 | 4562.84 | 4570.65104131696 | -7.8110413169625 |
| 31 | 4202.52 | 4232.29095539348 | -29.7709553934827 |
| 32 | 4296.49 | 4394.85633022535 | -98.3663302253485 |
| 33 | 4435.23 | 4649.13915955244 | -213.909159552437 |
| 34 | 4105.18 | 4268.7653319519 | -163.585331951902 |
| 35 | 4116.68 | 4365.00261910298 | -248.32261910298 |
| 36 | 3844.49 | 3932.56183304313 | -88.0718330431305 |
| 37 | 3720.98 | 3821.73351096514 | -100.753510965144 |
| 38 | 3674.4 | 3775.74604924036 | -101.346049240355 |
| 39 | 3857.62 | 4051.06814500642 | -193.44814500642 |
| 40 | 3801.06 | 4039.54165867668 | -238.481658676682 |
| 41 | 3504.37 | 3588.40813016654 | -84.038130166543 |
| 42 | 3032.6 | 3147.04862758206 | -114.448627582061 |
| 43 | 3047.03 | 3201.09123443071 | -154.061234430710 |
| 44 | 2962.34 | 3015.05805741985 | -52.7180574198503 |
| 45 | 2197.82 | 2143.03660030657 | 54.7833996934314 |
| 46 | 2014.45 | 1852.06258195837 | 162.387418041628 |
| 47 | 1862.83 | 1772.15903979430 | 90.6709602057027 |
| 48 | 1905.41 | 1960.6574325089 | -55.2474325089004 |
| 49 | 1810.99 | 1641.03707154452 | 169.952928455480 |
| 50 | 1670.07 | 1502.2210439599 | 167.848956040099 |
| 51 | 1864.44 | 1888.49329879755 | -24.0532987975484 |
| 52 | 2052.02 | 2012.95285899188 | 39.0671410081221 |
| 53 | 2029.6 | 2161.13756030815 | -131.537560308147 |
| 54 | 2070.83 | 2169.49230952799 | -98.662309527989 |
| 55 | 2293.41 | 2475.81178831734 | -182.401788317335 |
| 56 | 2443.27 | 2594.84126226240 | -151.571262262404 |
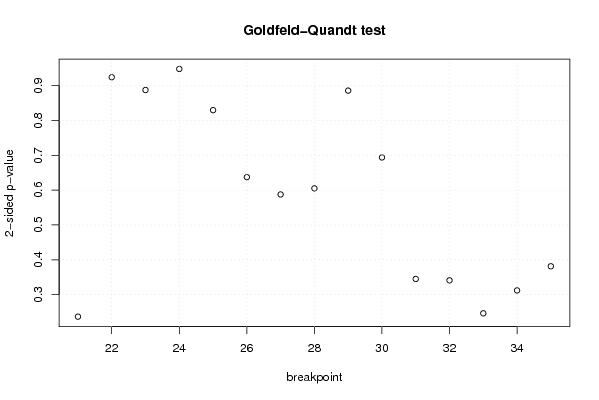
| Goldfeld-Quandt test for Heteroskedasticity | |||
| p-values | Alternative Hypothesis | ||
| breakpoint index | greater | 2-sided | less |
| 21 | 0.118370347929680 | 0.236740695859360 | 0.88162965207032 |
| 22 | 0.462008788190391 | 0.924017576380783 | 0.537991211809609 |
| 23 | 0.556326800470946 | 0.88734639905811 | 0.443673199529054 |
| 24 | 0.526104519208253 | 0.947790961583495 | 0.473895480791747 |
| 25 | 0.414746365643973 | 0.829492731287946 | 0.585253634356027 |
| 26 | 0.318588855657229 | 0.637177711314458 | 0.681411144342771 |
| 27 | 0.293754527124568 | 0.587509054249135 | 0.706245472875432 |
| 28 | 0.302504929634989 | 0.605009859269979 | 0.697495070365010 |
| 29 | 0.442805785766651 | 0.885611571533302 | 0.557194214233349 |
| 30 | 0.653126926372902 | 0.693746147254196 | 0.346873073627098 |
| 31 | 0.827516110172539 | 0.344967779654922 | 0.172483889827461 |
| 32 | 0.829517105969025 | 0.340965788061949 | 0.170482894030975 |
| 33 | 0.87684388002442 | 0.24631223995116 | 0.12315611997558 |
| 34 | 0.843980912666062 | 0.312038174667877 | 0.156019087333938 |
| 35 | 0.80933120846437 | 0.38133758307126 | 0.19066879153563 |
| Meta Analysis of Goldfeld-Quandt test for Heteroskedasticity | |||
| Description | # significant tests | % significant tests | OK/NOK |
| 1% type I error level | 0 | 0 | OK |
| 5% type I error level | 0 | 0 | OK |
| 10% type I error level | 0 | 0 | OK |