| Multiple Linear Regression - Estimated Regression Equation |
| Promet[t] = + 126.945161290323 -20.4486095661847Dummy[t] + e[t] |
| Multiple Linear Regression - Ordinary Least Squares | |||||
| Variable | Parameter | S.D. | T-STAT H0: parameter = 0 | 2-tail p-value | 1-tail p-value |
| (Intercept) | 126.945161290323 | 2.88491 | 44.0032 | 0 | 0 |
| Dummy | -20.4486095661847 | 4.149626 | -4.9278 | 7e-06 | 4e-06 |
| Multiple Linear Regression - Regression Statistics | |
| Multiple R | 0.543248724887231 |
| R-squared | 0.295119177091602 |
| Adjusted R-squared | 0.282966059455251 |
| F-TEST (value) | 24.2834131884694 |
| F-TEST (DF numerator) | 1 |
| F-TEST (DF denominator) | 58 |
| p-value | 7.29177659353208e-06 |
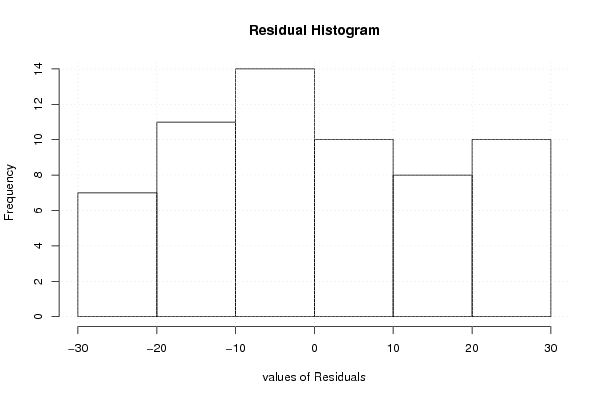
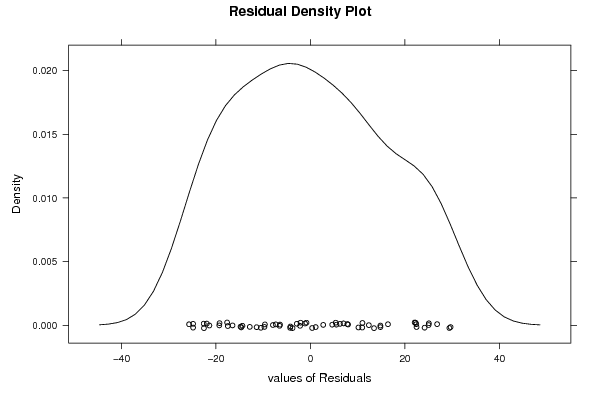
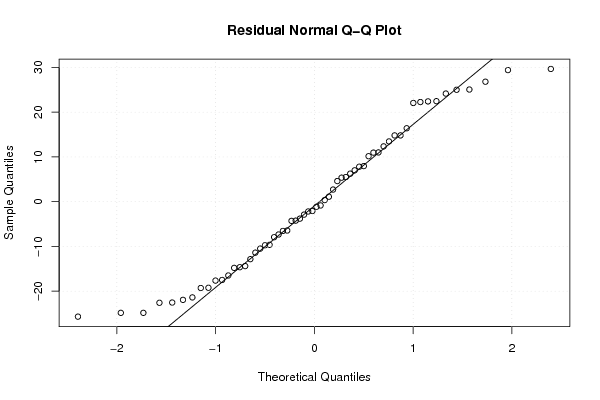
| Multiple Linear Regression - Residual Statistics | |
| Residual Standard Deviation | 16.0624999285474 |
| Sum Squared Residuals | 14964.2264293660 |
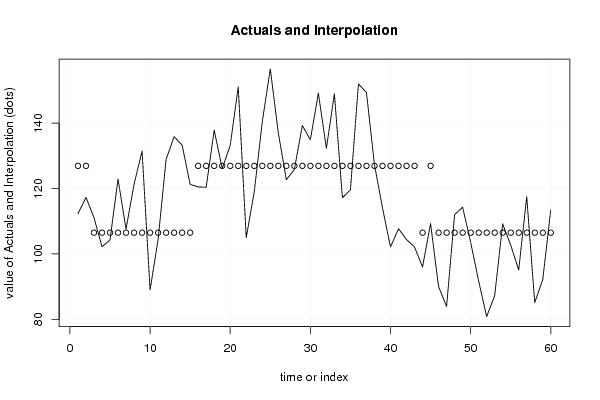
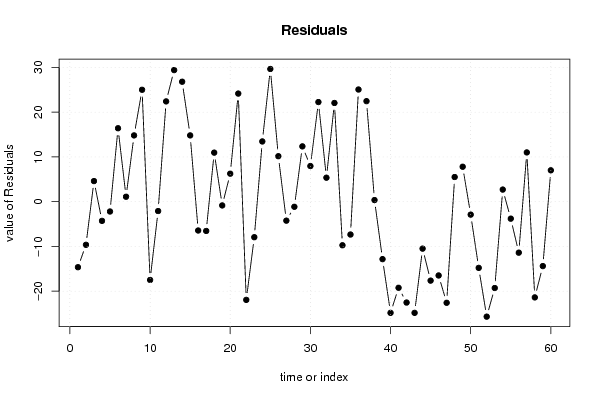
| Multiple Linear Regression - Actuals, Interpolation, and Residuals | |||
| Time or Index | Actuals | Interpolation Forecast | Residuals Prediction Error |
| 1 | 112.3 | 126.945161290323 | -14.6451612903225 |
| 2 | 117.3 | 126.945161290323 | -9.64516129032257 |
| 3 | 111.1 | 106.496551724138 | 4.60344827586206 |
| 4 | 102.2 | 106.496551724138 | -4.29655172413793 |
| 5 | 104.3 | 106.496551724138 | -2.19655172413793 |
| 6 | 122.9 | 106.496551724138 | 16.4034482758621 |
| 7 | 107.6 | 106.496551724138 | 1.10344827586206 |
| 8 | 121.3 | 106.496551724138 | 14.8034482758621 |
| 9 | 131.5 | 106.496551724138 | 25.0034482758621 |
| 10 | 89 | 106.496551724138 | -17.4965517241379 |
| 11 | 104.4 | 106.496551724138 | -2.09655172413792 |
| 12 | 128.9 | 106.496551724138 | 22.4034482758621 |
| 13 | 135.9 | 106.496551724138 | 29.4034482758621 |
| 14 | 133.3 | 106.496551724138 | 26.8034482758621 |
| 15 | 121.3 | 106.496551724138 | 14.8034482758621 |
| 16 | 120.5 | 126.945161290323 | -6.44516129032259 |
| 17 | 120.4 | 126.945161290323 | -6.54516129032258 |
| 18 | 137.9 | 126.945161290323 | 10.9548387096774 |
| 19 | 126.1 | 126.945161290323 | -0.84516129032259 |
| 20 | 133.2 | 126.945161290323 | 6.2548387096774 |
| 21 | 151.1 | 126.945161290323 | 24.1548387096774 |
| 22 | 105 | 126.945161290323 | -21.9451612903226 |
| 23 | 119 | 126.945161290323 | -7.94516129032259 |
| 24 | 140.4 | 126.945161290323 | 13.4548387096774 |
| 25 | 156.6 | 126.945161290323 | 29.6548387096774 |
| 26 | 137.1 | 126.945161290323 | 10.1548387096774 |
| 27 | 122.7 | 126.945161290323 | -4.24516129032258 |
| 28 | 125.8 | 126.945161290323 | -1.14516129032259 |
| 29 | 139.3 | 126.945161290323 | 12.3548387096774 |
| 30 | 134.9 | 126.945161290323 | 7.95483870967742 |
| 31 | 149.2 | 126.945161290323 | 22.2548387096774 |
| 32 | 132.3 | 126.945161290323 | 5.35483870967743 |
| 33 | 149 | 126.945161290323 | 22.0548387096774 |
| 34 | 117.2 | 126.945161290323 | -9.74516129032258 |
| 35 | 119.6 | 126.945161290323 | -7.34516129032259 |
| 36 | 152 | 126.945161290323 | 25.0548387096774 |
| 37 | 149.4 | 126.945161290323 | 22.4548387096774 |
| 38 | 127.3 | 126.945161290323 | 0.354838709677412 |
| 39 | 114.1 | 126.945161290323 | -12.8451612903226 |
| 40 | 102.1 | 126.945161290323 | -24.8451612903226 |
| 41 | 107.7 | 126.945161290323 | -19.2451612903226 |
| 42 | 104.4 | 126.945161290323 | -22.5451612903226 |
| 43 | 102.1 | 126.945161290323 | -24.8451612903226 |
| 44 | 96 | 106.496551724138 | -10.4965517241379 |
| 45 | 109.3 | 126.945161290323 | -17.6451612903226 |
| 46 | 90 | 106.496551724138 | -16.4965517241379 |
| 47 | 83.9 | 106.496551724138 | -22.5965517241379 |
| 48 | 112 | 106.496551724138 | 5.50344827586207 |
| 49 | 114.3 | 106.496551724138 | 7.80344827586207 |
| 50 | 103.6 | 106.496551724138 | -2.89655172413794 |
| 51 | 91.7 | 106.496551724138 | -14.7965517241379 |
| 52 | 80.8 | 106.496551724138 | -25.6965517241379 |
| 53 | 87.2 | 106.496551724138 | -19.2965517241379 |
| 54 | 109.2 | 106.496551724138 | 2.70344827586207 |
| 55 | 102.7 | 106.496551724138 | -3.79655172413793 |
| 56 | 95.1 | 106.496551724138 | -11.3965517241379 |
| 57 | 117.5 | 106.496551724138 | 11.0034482758621 |
| 58 | 85.1 | 106.496551724138 | -21.3965517241379 |
| 59 | 92.1 | 106.496551724138 | -14.3965517241379 |
| 60 | 113.5 | 106.496551724138 | 7.00344827586207 |
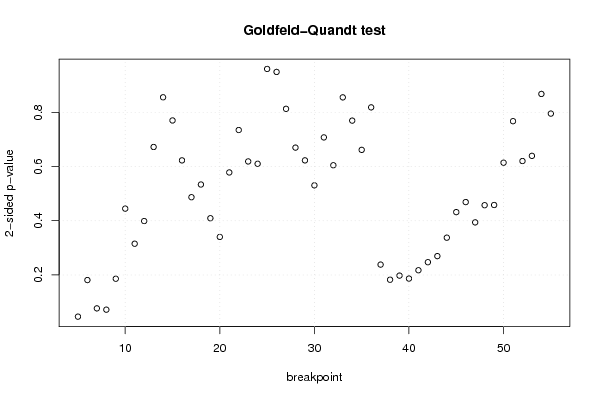
| Goldfeld-Quandt test for Heteroskedasticity | |||
| p-values | Alternative Hypothesis | ||
| breakpoint index | greater | 2-sided | less |
| 5 | 0.0230807756484898 | 0.0461615512969796 | 0.97691922435151 |
| 6 | 0.0905806267377687 | 0.181161253475537 | 0.909419373262231 |
| 7 | 0.0383608436546544 | 0.0767216873093089 | 0.961639156345346 |
| 8 | 0.0359614548621042 | 0.0719229097242083 | 0.964038545137896 |
| 9 | 0.0930248926986203 | 0.186049785397241 | 0.90697510730138 |
| 10 | 0.222341035474555 | 0.444682070949110 | 0.777658964525445 |
| 11 | 0.157610888174344 | 0.315221776348688 | 0.842389111825656 |
| 12 | 0.199439281456319 | 0.398878562912638 | 0.800560718543681 |
| 13 | 0.336052073986973 | 0.672104147973946 | 0.663947926013027 |
| 14 | 0.427709223928365 | 0.85541844785673 | 0.572290776071635 |
| 15 | 0.385004046968793 | 0.770008093937586 | 0.614995953031207 |
| 16 | 0.311385440157566 | 0.622770880315133 | 0.688614559842434 |
| 17 | 0.243410787969288 | 0.486821575938576 | 0.756589212030712 |
| 18 | 0.266829653412278 | 0.533659306824556 | 0.733170346587722 |
| 19 | 0.204623831729636 | 0.409247663459272 | 0.795376168270364 |
| 20 | 0.170095883916747 | 0.340191767833495 | 0.829904116083253 |
| 21 | 0.289091557784065 | 0.57818311556813 | 0.710908442215935 |
| 22 | 0.367323929648787 | 0.734647859297573 | 0.632676070351213 |
| 23 | 0.309397081160769 | 0.618794162321538 | 0.690602918839231 |
| 24 | 0.305082153502036 | 0.610164307004071 | 0.694917846497964 |
| 25 | 0.519998041566075 | 0.96000391686785 | 0.480001958433925 |
| 26 | 0.474491957530377 | 0.948983915060754 | 0.525508042469623 |
| 27 | 0.406419407919283 | 0.812838815838566 | 0.593580592080717 |
| 28 | 0.334907484828507 | 0.669814969657013 | 0.665092515171493 |
| 29 | 0.311389956257161 | 0.622779912514321 | 0.68861004374284 |
| 30 | 0.265298690366661 | 0.530597380733322 | 0.734701309633339 |
| 31 | 0.353734057273741 | 0.707468114547482 | 0.646265942726259 |
| 32 | 0.302373615137733 | 0.604747230275467 | 0.697626384862267 |
| 33 | 0.427609212603286 | 0.855218425206572 | 0.572390787396714 |
| 34 | 0.384700599303244 | 0.769401198606489 | 0.615299400696756 |
| 35 | 0.330745477617996 | 0.661490955235991 | 0.669254522382004 |
| 36 | 0.590877778353696 | 0.818244443292609 | 0.409122221646304 |
| 37 | 0.880925836241047 | 0.238148327517906 | 0.119074163758953 |
| 38 | 0.908800211932195 | 0.182399576135611 | 0.0911997880678054 |
| 39 | 0.901226997101382 | 0.197546005797236 | 0.098773002898618 |
| 40 | 0.906648416699392 | 0.186703166601215 | 0.0933515833006077 |
| 41 | 0.891334113045205 | 0.217331773909591 | 0.108665886954795 |
| 42 | 0.87644982390424 | 0.24710035219152 | 0.12355017609576 |
| 43 | 0.865254266147261 | 0.269491467705477 | 0.134745733852739 |
| 44 | 0.8312464825277 | 0.337507034944602 | 0.168753517472301 |
| 45 | 0.784100456087555 | 0.43179908782489 | 0.215899543912445 |
| 46 | 0.765569849506269 | 0.468860300987462 | 0.234430150493731 |
| 47 | 0.803018769922026 | 0.393962460155948 | 0.196981230077974 |
| 48 | 0.771328082949654 | 0.457343834100691 | 0.228671917050346 |
| 49 | 0.770957896951003 | 0.458084206097994 | 0.229042103048997 |
| 50 | 0.692941824489683 | 0.614116351020634 | 0.307058175510317 |
| 51 | 0.616327676760239 | 0.767344646479522 | 0.383672323239761 |
| 52 | 0.689881373928263 | 0.620237252143474 | 0.310118626071737 |
| 53 | 0.680308998087868 | 0.639382003824263 | 0.319691001912132 |
| 54 | 0.566080043143866 | 0.867839913712268 | 0.433919956856134 |
| 55 | 0.397654283207018 | 0.795308566414036 | 0.602345716792982 |
| Meta Analysis of Goldfeld-Quandt test for Heteroskedasticity | |||
| Description | # significant tests | % significant tests | OK/NOK |
| 1% type I error level | 0 | 0 | OK |
| 5% type I error level | 1 | 0.0196078431372549 | OK |
| 10% type I error level | 3 | 0.0588235294117647 | OK |