| Multiple Linear Regression - Estimated Regression Equation |
| cultuurbestedingen[t] = + 100.676931818182 -0.0904886363636757M1[t] -0.0355909090909093M2[t] -0.298693181818184M3[t] -0.109795454545457M4[t] -0.394897727272728M5[t] -0.384000000000005M6[t] -0.543102272727275M7[t] -0.488204545454551M8[t] + 0.514693181818181M9[t] + 0.391590909090904M10[t] + 0.139602272727273M11[t] + 0.327102272727273t + e[t] |
| Multiple Linear Regression - Ordinary Least Squares | |||||
| Variable | Parameter | S.D. | T-STAT H0: parameter = 0 | 2-tail p-value | 1-tail p-value |
| (Intercept) | 100.676931818182 | 0.337006 | 298.7392 | 0 | 0 |
| M1 | -0.0904886363636757 | 0.40885 | -0.2213 | 0.825841 | 0.41292 |
| M2 | -0.0355909090909093 | 0.408592 | -0.0871 | 0.930974 | 0.465487 |
| M3 | -0.298693181818184 | 0.408392 | -0.7314 | 0.468334 | 0.234167 |
| M4 | -0.109795454545457 | 0.408249 | -0.2689 | 0.789203 | 0.394602 |
| M5 | -0.394897727272728 | 0.408163 | -0.9675 | 0.338466 | 0.169233 |
| M6 | -0.384000000000005 | 0.408135 | -0.9409 | 0.351797 | 0.175899 |
| M7 | -0.543102272727275 | 0.408163 | -1.3306 | 0.190024 | 0.095012 |
| M8 | -0.488204545454551 | 0.408249 | -1.1958 | 0.238019 | 0.119009 |
| M9 | 0.514693181818181 | 0.408392 | 1.2603 | 0.214061 | 0.10703 |
| M10 | 0.391590909090904 | 0.408592 | 0.9584 | 0.342987 | 0.171494 |
| M11 | 0.139602272727273 | 0.430239 | 0.3245 | 0.747081 | 0.373541 |
| t | 0.327102272727273 | 0.004834 | 67.665 | 0 | 0 |
| Multiple Linear Regression - Regression Statistics | |
| Multiple R | 0.995287469888219 |
| R-squared | 0.990597147716492 |
| Adjusted R-squared | 0.98808972044089 |
| F-TEST (value) | 395.065155968917 |
| F-TEST (DF numerator) | 12 |
| F-TEST (DF denominator) | 45 |
| p-value | 0 |
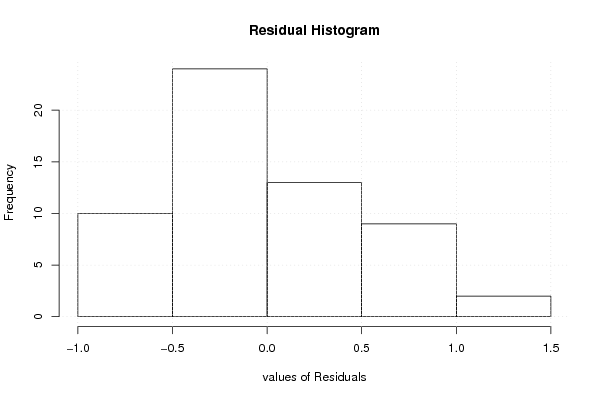
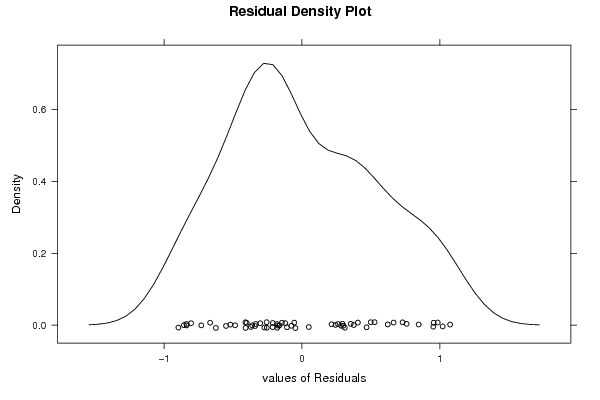
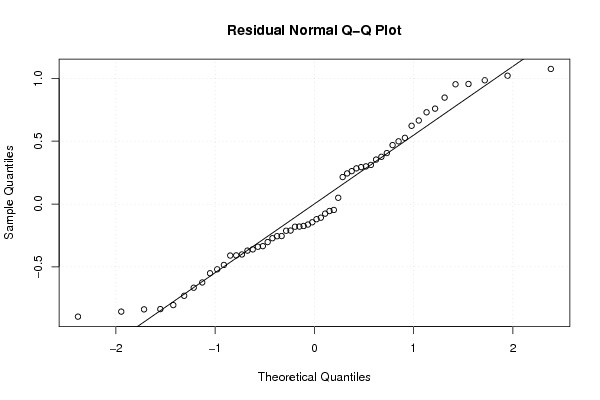
| Multiple Linear Regression - Residual Statistics | |
| Residual Standard Deviation | 0.608411215437963 |
| Sum Squared Residuals | 16.6573893181815 |
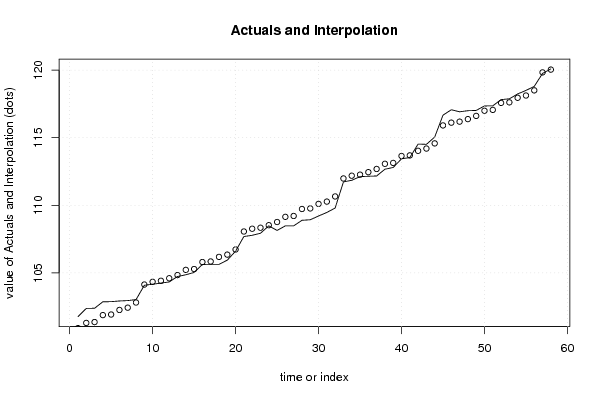
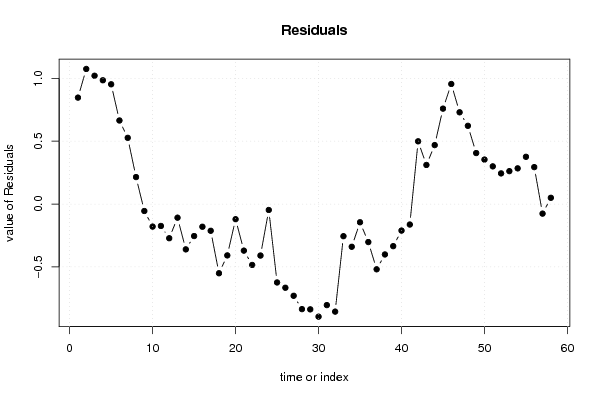
| Multiple Linear Regression - Actuals, Interpolation, and Residuals | |||
| Time or Index | Actuals | Interpolation Forecast | Residuals Prediction Error |
| 1 | 101.76 | 100.913545454546 | 0.8464545454544 |
| 2 | 102.37 | 101.295545454545 | 1.07445454545456 |
| 3 | 102.38 | 101.359545454545 | 1.02045454545455 |
| 4 | 102.86 | 101.875545454545 | 0.984454545454554 |
| 5 | 102.87 | 101.917545454545 | 0.952454545454556 |
| 6 | 102.92 | 102.255545454545 | 0.664454545454556 |
| 7 | 102.95 | 102.423545454545 | 0.526454545454552 |
| 8 | 103.02 | 102.805545454545 | 0.214454545454550 |
| 9 | 104.08 | 104.135545454545 | -0.0555454545454519 |
| 10 | 104.16 | 104.339545454545 | -0.179545454545448 |
| 11 | 104.24 | 104.414659090909 | -0.174659090909094 |
| 12 | 104.33 | 104.602159090909 | -0.272159090909090 |
| 13 | 104.73 | 104.838772727273 | -0.108772727272686 |
| 14 | 104.86 | 105.220772727273 | -0.360772727272726 |
| 15 | 105.03 | 105.284772727273 | -0.254772727272721 |
| 16 | 105.62 | 105.800772727273 | -0.180772727272719 |
| 17 | 105.63 | 105.842772727273 | -0.212772727272730 |
| 18 | 105.63 | 106.180772727273 | -0.550772727272726 |
| 19 | 105.94 | 106.348772727273 | -0.408772727272727 |
| 20 | 106.61 | 106.730772727273 | -0.120772727272722 |
| 21 | 107.69 | 108.060772727273 | -0.370772727272728 |
| 22 | 107.78 | 108.264772727273 | -0.484772727272721 |
| 23 | 107.93 | 108.339886363636 | -0.409886363636357 |
| 24 | 108.48 | 108.527386363636 | -0.0473863636363603 |
| 25 | 108.14 | 108.764 | -0.623999999999961 |
| 26 | 108.48 | 109.146 | -0.665999999999997 |
| 27 | 108.48 | 109.21 | -0.729999999999996 |
| 28 | 108.89 | 109.726 | -0.836 |
| 29 | 108.93 | 109.768 | -0.837999999999994 |
| 30 | 109.21 | 110.106 | -0.896000000000003 |
| 31 | 109.47 | 110.274 | -0.804000000000001 |
| 32 | 109.8 | 110.656 | -0.856 |
| 33 | 111.73 | 111.986 | -0.255999999999998 |
| 34 | 111.85 | 112.19 | -0.340000000000003 |
| 35 | 112.12 | 112.265113636364 | -0.145113636363636 |
| 36 | 112.15 | 112.452613636364 | -0.302613636363634 |
| 37 | 112.17 | 112.689227272727 | -0.519227272727236 |
| 38 | 112.67 | 113.071227272727 | -0.401227272727275 |
| 39 | 112.8 | 113.135227272727 | -0.335227272727279 |
| 40 | 113.44 | 113.651227272727 | -0.211227272727276 |
| 41 | 113.53 | 113.693227272727 | -0.163227272727276 |
| 42 | 114.53 | 114.031227272727 | 0.498772727272728 |
| 43 | 114.51 | 114.199227272727 | 0.31077272727273 |
| 44 | 115.05 | 114.581227272727 | 0.468772727272723 |
| 45 | 116.67 | 115.911227272727 | 0.758772727272726 |
| 46 | 117.07 | 116.115227272727 | 0.954772727272719 |
| 47 | 116.92 | 116.190340909091 | 0.729659090909087 |
| 48 | 117 | 116.377840909091 | 0.622159090909084 |
| 49 | 117.02 | 116.614454545455 | 0.405545454545484 |
| 50 | 117.35 | 116.996454545455 | 0.353545454545441 |
| 51 | 117.36 | 117.060454545455 | 0.299545454545449 |
| 52 | 117.82 | 117.576454545455 | 0.243545454545441 |
| 53 | 117.88 | 117.618454545455 | 0.261545454545443 |
| 54 | 118.24 | 117.956454545455 | 0.283545454545445 |
| 55 | 118.5 | 118.124454545455 | 0.375545454545446 |
| 56 | 118.8 | 118.506454545455 | 0.293545454545448 |
| 57 | 119.76 | 119.836454545455 | -0.0764545454545479 |
| 58 | 120.09 | 120.040454545455 | 0.0495454545454534 |
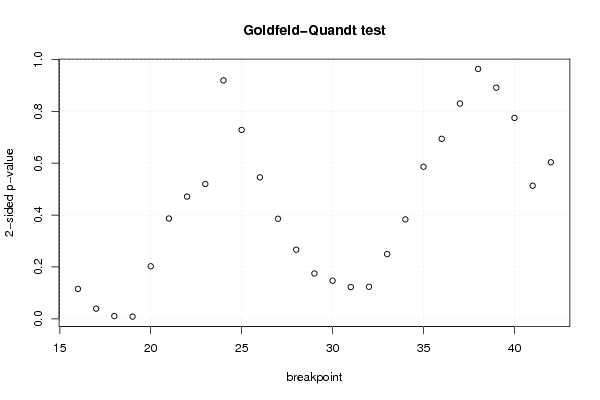
| Goldfeld-Quandt test for Heteroskedasticity | |||
| p-values | Alternative Hypothesis | ||
| breakpoint index | greater | 2-sided | less |
| 16 | 0.0577063209451337 | 0.115412641890267 | 0.942293679054866 |
| 17 | 0.019739302720929 | 0.039478605441858 | 0.98026069727907 |
| 18 | 0.00535063146476295 | 0.0107012629295259 | 0.994649368535237 |
| 19 | 0.00426899606102586 | 0.00853799212205172 | 0.995731003938974 |
| 20 | 0.101377248225139 | 0.202754496450278 | 0.898622751774861 |
| 21 | 0.193496468950704 | 0.386992937901409 | 0.806503531049296 |
| 22 | 0.23564473531261 | 0.47128947062522 | 0.76435526468739 |
| 23 | 0.260027382888729 | 0.520054765777459 | 0.73997261711127 |
| 24 | 0.459618447572013 | 0.919236895144027 | 0.540381552427987 |
| 25 | 0.364204097994080 | 0.728408195988161 | 0.63579590200592 |
| 26 | 0.272759828499019 | 0.545519656998037 | 0.727240171500981 |
| 27 | 0.192915890128645 | 0.38583178025729 | 0.807084109871355 |
| 28 | 0.133282101613712 | 0.266564203227424 | 0.866717898386288 |
| 29 | 0.087544386586833 | 0.175088773173666 | 0.912455613413167 |
| 30 | 0.0735845586927203 | 0.147169117385441 | 0.92641544130728 |
| 31 | 0.0612717359939966 | 0.122543471987993 | 0.938728264006003 |
| 32 | 0.0618462774547846 | 0.123692554909569 | 0.938153722545215 |
| 33 | 0.124886854057839 | 0.249773708115677 | 0.875113145942161 |
| 34 | 0.191697033206658 | 0.383394066413315 | 0.808302966793342 |
| 35 | 0.293236428130620 | 0.586472856261239 | 0.70676357186938 |
| 36 | 0.347076714499657 | 0.694153428999314 | 0.652923285500343 |
| 37 | 0.415023206029050 | 0.830046412058099 | 0.58497679397095 |
| 38 | 0.481716329291994 | 0.963432658583987 | 0.518283670708006 |
| 39 | 0.554444443730949 | 0.891111112538102 | 0.445555556269051 |
| 40 | 0.612593154997251 | 0.774813690005497 | 0.387406845002749 |
| 41 | 0.743354509673895 | 0.51329098065221 | 0.256645490326105 |
| 42 | 0.698178696460079 | 0.603642607079842 | 0.301821303539921 |
| Meta Analysis of Goldfeld-Quandt test for Heteroskedasticity | |||
| Description | # significant tests | % significant tests | OK/NOK |
| 1% type I error level | 1 | 0.037037037037037 | NOK |
| 5% type I error level | 3 | 0.111111111111111 | NOK |
| 10% type I error level | 3 | 0.111111111111111 | NOK |