Free Statistics
of Irreproducible Research!
Description of Statistical Computation | |||||||||||||||||||||||||||||||||||||||||
|---|---|---|---|---|---|---|---|---|---|---|---|---|---|---|---|---|---|---|---|---|---|---|---|---|---|---|---|---|---|---|---|---|---|---|---|---|---|---|---|---|---|
| Author's title | |||||||||||||||||||||||||||||||||||||||||
| Author | *Unverified author* | ||||||||||||||||||||||||||||||||||||||||
| R Software Module | rwasp_univariatedataseries.wasp | ||||||||||||||||||||||||||||||||||||||||
| Title produced by software | Univariate Data Series | ||||||||||||||||||||||||||||||||||||||||
| Date of computation | Sun, 07 Feb 2010 14:50:24 -0700 | ||||||||||||||||||||||||||||||||||||||||
| Cite this page as follows | Statistical Computations at FreeStatistics.org, Office for Research Development and Education, URL https://freestatistics.org/blog/index.php?v=date/2010/Feb/07/t1265579504ihdsho0n48m93ly.htm/, Retrieved Thu, 25 Apr 2024 12:51:03 +0000 | ||||||||||||||||||||||||||||||||||||||||
| Statistical Computations at FreeStatistics.org, Office for Research Development and Education, URL https://freestatistics.org/blog/index.php?pk=72866, Retrieved Thu, 25 Apr 2024 12:51:03 +0000 | |||||||||||||||||||||||||||||||||||||||||
| QR Codes: | |||||||||||||||||||||||||||||||||||||||||
|
| |||||||||||||||||||||||||||||||||||||||||
| Original text written by user: | |||||||||||||||||||||||||||||||||||||||||
| IsPrivate? | No (this computation is public) | ||||||||||||||||||||||||||||||||||||||||
| User-defined keywords | KDGP1W1 | ||||||||||||||||||||||||||||||||||||||||
| Estimated Impact | 229 | ||||||||||||||||||||||||||||||||||||||||
Tree of Dependent Computations | |||||||||||||||||||||||||||||||||||||||||
| Family? (F = Feedback message, R = changed R code, M = changed R Module, P = changed Parameters, D = changed Data) | |||||||||||||||||||||||||||||||||||||||||
| - [Univariate Data Series] [] [2010-02-07 21:50:24] [6be1587f4b9760ef373df169f4355671] [Current] - RM D [Histogram] [] [2010-02-14 19:39:21] [3daad67e528f50bef1247331835a3186] - RM D [Kernel Density Estimation] [] [2010-02-14 19:47:28] [3daad67e528f50bef1247331835a3186] | |||||||||||||||||||||||||||||||||||||||||
| Feedback Forum | |||||||||||||||||||||||||||||||||||||||||
Post a new message | |||||||||||||||||||||||||||||||||||||||||
Dataset | |||||||||||||||||||||||||||||||||||||||||
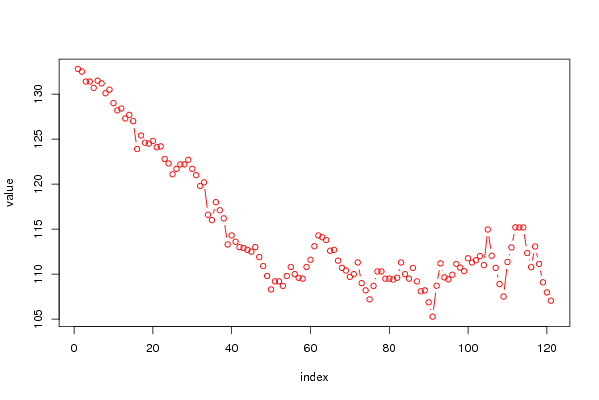
| Dataseries X: | |||||||||||||||||||||||||||||||||||||||||
132,8 132,5 131,4 131,4 130,7 131,5 131,2 130,1 130,5 129 128,2 128,4 127,3 127,7 127 123,9 125,4 124,6 124,5 124,8 124,1 124,2 122,8 122,3 121,1 121,7 122,2 122,2 122,7 121,7 121 119,8 120,2 116,6 116 118 117,1 116,2 113,3 114,3 113,6 113 112,9 112,7 112,5 113 111,9 110,9 109,8 108,3 109,2 109,2 108,7 109,8 110,8 110 109,6 109,5 110,8 111,6 113,1 114,3 114,1 113,8 112,6 112,7 111,5 110,7 110,4 109,7 110 111,3 109 108,2 107,2 108,7 110,3 110,3 109,5 109,5 109,4 109,6 111,3 110 109,5 110,693 109,195 108,095 108,199 106,87 105,278 108,711 111,192 109,641 109,42 109,935 111,126 110,733 110,34 111,766 111,294 111,54 112,008 111,007 114,963 112,045 110,703 108,894 107,51 111,35 112,964 115,203 115,182 115,191 112,346 110,774 113,07 111,138 109,092 107,971 107,051 | |||||||||||||||||||||||||||||||||||||||||
Tables (Output of Computation) | |||||||||||||||||||||||||||||||||||||||||
| |||||||||||||||||||||||||||||||||||||||||
Figures (Output of Computation) | |||||||||||||||||||||||||||||||||||||||||
Input Parameters & R Code | |||||||||||||||||||||||||||||||||||||||||
| Parameters (Session): | |||||||||||||||||||||||||||||||||||||||||
| par1 = Evolutie consumentenprijzen broeken en shorts ; par2 = Januari 2000 - December 2009 ; | |||||||||||||||||||||||||||||||||||||||||
| Parameters (R input): | |||||||||||||||||||||||||||||||||||||||||
| par1 = Evolutie consumentenprijzen broeken en shorts ; par2 = Januari 2000 - December 2009 ; par3 = ; | |||||||||||||||||||||||||||||||||||||||||
| R code (references can be found in the software module): | |||||||||||||||||||||||||||||||||||||||||
bitmap(file='test1.png') | |||||||||||||||||||||||||||||||||||||||||