Free Statistics
of Irreproducible Research!
Description of Statistical Computation | |||||||||||||||||||||||||||||||||||||||||
|---|---|---|---|---|---|---|---|---|---|---|---|---|---|---|---|---|---|---|---|---|---|---|---|---|---|---|---|---|---|---|---|---|---|---|---|---|---|---|---|---|---|
| Author's title | |||||||||||||||||||||||||||||||||||||||||
| Author | *Unverified author* | ||||||||||||||||||||||||||||||||||||||||
| R Software Module | rwasp_univariatedataseries.wasp | ||||||||||||||||||||||||||||||||||||||||
| Title produced by software | Univariate Data Series | ||||||||||||||||||||||||||||||||||||||||
| Date of computation | Wed, 10 Feb 2010 03:05:26 -0700 | ||||||||||||||||||||||||||||||||||||||||
| Cite this page as follows | Statistical Computations at FreeStatistics.org, Office for Research Development and Education, URL https://freestatistics.org/blog/index.php?v=date/2010/Feb/10/t1265796432plrwvb1ifhkb0vq.htm/, Retrieved Sat, 20 Apr 2024 03:02:12 +0000 | ||||||||||||||||||||||||||||||||||||||||
| Statistical Computations at FreeStatistics.org, Office for Research Development and Education, URL https://freestatistics.org/blog/index.php?pk=72931, Retrieved Sat, 20 Apr 2024 03:02:12 +0000 | |||||||||||||||||||||||||||||||||||||||||
| QR Codes: | |||||||||||||||||||||||||||||||||||||||||
|
| |||||||||||||||||||||||||||||||||||||||||
| Original text written by user: | |||||||||||||||||||||||||||||||||||||||||
| IsPrivate? | No (this computation is public) | ||||||||||||||||||||||||||||||||||||||||
| User-defined keywords | |||||||||||||||||||||||||||||||||||||||||
| Estimated Impact | 146 | ||||||||||||||||||||||||||||||||||||||||
Tree of Dependent Computations | |||||||||||||||||||||||||||||||||||||||||
| Family? (F = Feedback message, R = changed R code, M = changed R Module, P = changed Parameters, D = changed Data) | |||||||||||||||||||||||||||||||||||||||||
| - [Univariate Data Series] [Verkoop witte wij...] [2010-02-10 10:05:26] [03859715711bd3369851d387eaa83ba4] [Current] | |||||||||||||||||||||||||||||||||||||||||
| Feedback Forum | |||||||||||||||||||||||||||||||||||||||||
Post a new message | |||||||||||||||||||||||||||||||||||||||||
Dataset | |||||||||||||||||||||||||||||||||||||||||
| Dataseries X: | |||||||||||||||||||||||||||||||||||||||||
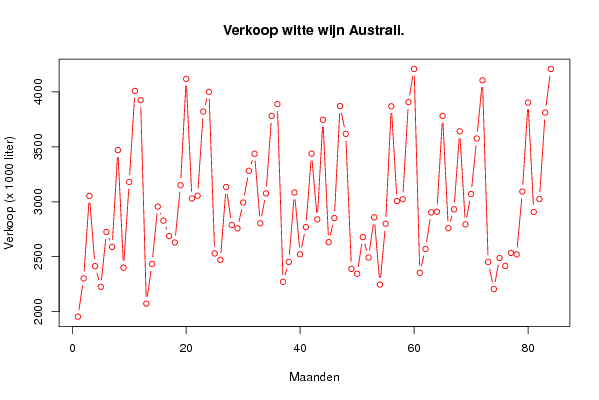
1954 2302 3054 2414 2226 2725 2589 3470 2400 3180 4009 3924 2072 2434 2956 2828 2687 2629 3150 4119 3030 3055 3821 4001 2529 2472 3134 2789 2758 2993 3282 3437 2804 3076 3782 3889 2271 2452 3084 2522 2769 3438 2839 3746 2632 2851 3871 3618 2389 2344 2678 2492 2858 2246 2800 3869 3007 3023 3907 4209 2353 2570 2903 2910 3782 2759 2931 3641 2794 3070 3576 4106 2452 2206 2488 2416 2534 2521 3093 3903 2907 3025 3812 4209 | |||||||||||||||||||||||||||||||||||||||||
Tables (Output of Computation) | |||||||||||||||||||||||||||||||||||||||||
| |||||||||||||||||||||||||||||||||||||||||
Figures (Output of Computation) | |||||||||||||||||||||||||||||||||||||||||
Input Parameters & R Code | |||||||||||||||||||||||||||||||||||||||||
| Parameters (Session): | |||||||||||||||||||||||||||||||||||||||||
| par1 = Witte wijn verkoop Australi� (1000liter) ; par2 = http://www-personal.buseco.monash.edu.au/~hyndman/TSDL/index.htm ; par3 = Witte wijn verkoop in Australi� van januari 1980 tot december 1986 (1000liter) ; | |||||||||||||||||||||||||||||||||||||||||
| Parameters (R input): | |||||||||||||||||||||||||||||||||||||||||
| par1 = Witte wijn verkoop Australi� (1000liter) ; par2 = http://www-personal.buseco.monash.edu.au/~hyndman/TSDL/index.htm ; par3 = Witte wijn verkoop in Australi� van januari 1980 tot december 1986 (1000liter) ; | |||||||||||||||||||||||||||||||||||||||||
| R code (references can be found in the software module): | |||||||||||||||||||||||||||||||||||||||||
bitmap(file='test1.png') | |||||||||||||||||||||||||||||||||||||||||