Free Statistics
of Irreproducible Research!
Description of Statistical Computation | |||||||||||||||||||||||||||||||||||||||||
|---|---|---|---|---|---|---|---|---|---|---|---|---|---|---|---|---|---|---|---|---|---|---|---|---|---|---|---|---|---|---|---|---|---|---|---|---|---|---|---|---|---|
| Author's title | |||||||||||||||||||||||||||||||||||||||||
| Author | *Unverified author* | ||||||||||||||||||||||||||||||||||||||||
| R Software Module | rwasp_univariatedataseries.wasp | ||||||||||||||||||||||||||||||||||||||||
| Title produced by software | Univariate Data Series | ||||||||||||||||||||||||||||||||||||||||
| Date of computation | Wed, 10 Feb 2010 11:24:23 -0700 | ||||||||||||||||||||||||||||||||||||||||
| Cite this page as follows | Statistical Computations at FreeStatistics.org, Office for Research Development and Education, URL https://freestatistics.org/blog/index.php?v=date/2010/Feb/10/t1265826768laahlt8e0pzsy5c.htm/, Retrieved Sat, 20 Apr 2024 12:06:21 +0000 | ||||||||||||||||||||||||||||||||||||||||
| Statistical Computations at FreeStatistics.org, Office for Research Development and Education, URL https://freestatistics.org/blog/index.php?pk=72981, Retrieved Sat, 20 Apr 2024 12:06:21 +0000 | |||||||||||||||||||||||||||||||||||||||||
| QR Codes: | |||||||||||||||||||||||||||||||||||||||||
|
| |||||||||||||||||||||||||||||||||||||||||
| Original text written by user: | |||||||||||||||||||||||||||||||||||||||||
| IsPrivate? | No (this computation is public) | ||||||||||||||||||||||||||||||||||||||||
| User-defined keywords | |||||||||||||||||||||||||||||||||||||||||
| Estimated Impact | 150 | ||||||||||||||||||||||||||||||||||||||||
Tree of Dependent Computations | |||||||||||||||||||||||||||||||||||||||||
| Family? (F = Feedback message, R = changed R code, M = changed R Module, P = changed Parameters, D = changed Data) | |||||||||||||||||||||||||||||||||||||||||
| - [Univariate Data Series] [] [2010-02-10 18:24:23] [850dbf9e683f79d78a1e8310559edb6e] [Current] - RMPD [Histogram] [] [2010-02-24 19:51:50] [161ef0a390b8cdcef4d072aaf517d0be] - RMPD [Histogram] [] [2010-02-24 19:54:41] [161ef0a390b8cdcef4d072aaf517d0be] - RMPD [Kernel Density Estimation] [] [2010-02-24 19:58:52] [161ef0a390b8cdcef4d072aaf517d0be] | |||||||||||||||||||||||||||||||||||||||||
| Feedback Forum | |||||||||||||||||||||||||||||||||||||||||
Post a new message | |||||||||||||||||||||||||||||||||||||||||
Dataset | |||||||||||||||||||||||||||||||||||||||||
| Dataseries X: | |||||||||||||||||||||||||||||||||||||||||
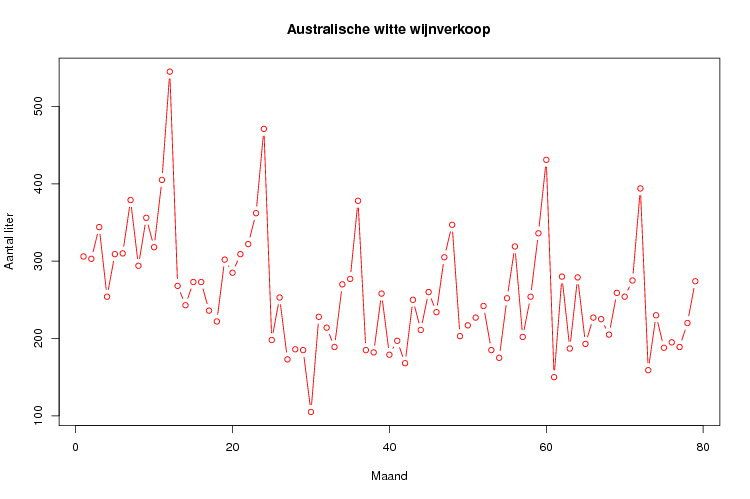
306 303 344 254 309 310 379 294 356 318 405 545 268 243 273 273 236 222 302 285 309 322 362 471 198 253 173 186 185 105 228 214 189 270 277 378 185 182 258 179 197 168 250 211 260 234 305 347 203 217 227 242 185 175 252 319 202 254 336 431 150 280 187 279 193 227 225 205 259 254 275 394 159 230 188 195 189 220 274 | |||||||||||||||||||||||||||||||||||||||||
Tables (Output of Computation) | |||||||||||||||||||||||||||||||||||||||||
| |||||||||||||||||||||||||||||||||||||||||
Figures (Output of Computation) | |||||||||||||||||||||||||||||||||||||||||
Input Parameters & R Code | |||||||||||||||||||||||||||||||||||||||||
| Parameters (Session): | |||||||||||||||||||||||||||||||||||||||||
| par1 = Australische wijnverkoop ; par2 = http://www-personal.buseco.monash.edu.au/~hyndman/TSDL/index.htm ; par3 = Maandelijkse Australische wijnverkoop ; | |||||||||||||||||||||||||||||||||||||||||
| Parameters (R input): | |||||||||||||||||||||||||||||||||||||||||
| par1 = Australische wijnverkoop ; par2 = http://www-personal.buseco.monash.edu.au/~hyndman/TSDL/index.htm ; par3 = Maandelijkse Australische wijnverkoop ; | |||||||||||||||||||||||||||||||||||||||||
| R code (references can be found in the software module): | |||||||||||||||||||||||||||||||||||||||||
bitmap(file='test1.png') | |||||||||||||||||||||||||||||||||||||||||