Free Statistics
of Irreproducible Research!
Description of Statistical Computation | ||||||||||||||||||||||||||||||||||
|---|---|---|---|---|---|---|---|---|---|---|---|---|---|---|---|---|---|---|---|---|---|---|---|---|---|---|---|---|---|---|---|---|---|---|
| Author's title | ||||||||||||||||||||||||||||||||||
| Author | *Unverified author* | |||||||||||||||||||||||||||||||||
| R Software Module | rwasp_varia1.wasp | |||||||||||||||||||||||||||||||||
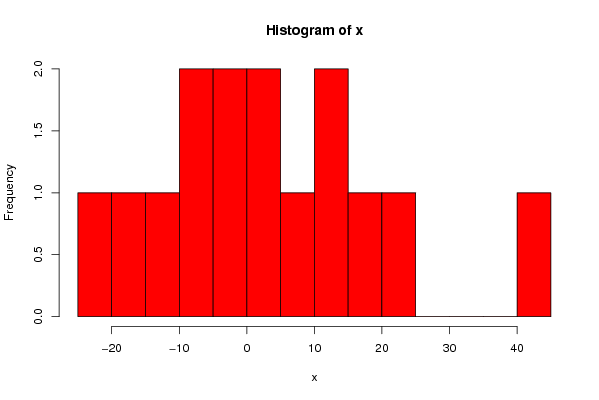
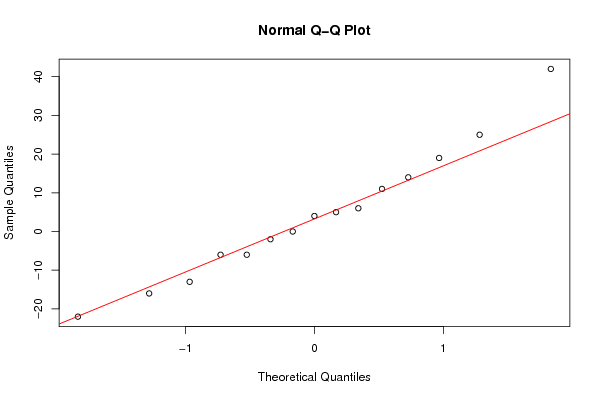
| Title produced by software | Histogram and QQplot | |||||||||||||||||||||||||||||||||
| Date of computation | Wed, 02 Jun 2010 08:59:14 +0000 | |||||||||||||||||||||||||||||||||
| Cite this page as follows | Statistical Computations at FreeStatistics.org, Office for Research Development and Education, URL https://freestatistics.org/blog/index.php?v=date/2010/Jun/02/t12754691990ycuvr5fiev6gq2.htm/, Retrieved Thu, 25 Apr 2024 10:30:37 +0000 | |||||||||||||||||||||||||||||||||
| Statistical Computations at FreeStatistics.org, Office for Research Development and Education, URL https://freestatistics.org/blog/index.php?pk=76953, Retrieved Thu, 25 Apr 2024 10:30:37 +0000 | ||||||||||||||||||||||||||||||||||
| QR Codes: | ||||||||||||||||||||||||||||||||||
|
| ||||||||||||||||||||||||||||||||||
| Original text written by user: | ||||||||||||||||||||||||||||||||||
| IsPrivate? | No (this computation is public) | |||||||||||||||||||||||||||||||||
| User-defined keywords | ||||||||||||||||||||||||||||||||||
| Estimated Impact | 148 | |||||||||||||||||||||||||||||||||
Tree of Dependent Computations | ||||||||||||||||||||||||||||||||||
| Family? (F = Feedback message, R = changed R code, M = changed R Module, P = changed Parameters, D = changed Data) | ||||||||||||||||||||||||||||||||||
| - [Histogram and QQplot] [goodhighgraph] [2010-06-02 08:53:25] [7bfba1b72b0797c6072d7d3749334d94] - D [Histogram and QQplot] [goodhoghqq] [2010-06-02 08:59:14] [e5cd08555908904b75b652e70522c579] [Current] | ||||||||||||||||||||||||||||||||||
| Feedback Forum | ||||||||||||||||||||||||||||||||||
Post a new message | ||||||||||||||||||||||||||||||||||
Dataset | ||||||||||||||||||||||||||||||||||
| Dataseries X: | ||||||||||||||||||||||||||||||||||
25 0 -16 5 11 -6 42 -2 -13 14 4 -22 19 6 -6 | ||||||||||||||||||||||||||||||||||
Tables (Output of Computation) | ||||||||||||||||||||||||||||||||||
| ||||||||||||||||||||||||||||||||||
Figures (Output of Computation) | ||||||||||||||||||||||||||||||||||
Input Parameters & R Code | ||||||||||||||||||||||||||||||||||
| Parameters (Session): | ||||||||||||||||||||||||||||||||||
| par1 = 10 ; | ||||||||||||||||||||||||||||||||||
| Parameters (R input): | ||||||||||||||||||||||||||||||||||
| par1 = 10 ; | ||||||||||||||||||||||||||||||||||
| R code (references can be found in the software module): | ||||||||||||||||||||||||||||||||||
bitmap(file='test1.png') | ||||||||||||||||||||||||||||||||||