Free Statistics
of Irreproducible Research!
Description of Statistical Computation | ||||||||||||||||||||||||||||||
|---|---|---|---|---|---|---|---|---|---|---|---|---|---|---|---|---|---|---|---|---|---|---|---|---|---|---|---|---|---|---|
| Author's title | ||||||||||||||||||||||||||||||
| Author | *The author of this computation has been verified* | |||||||||||||||||||||||||||||
| R Software Module | rwasp_Reddy-Moores DAta.wasp | |||||||||||||||||||||||||||||
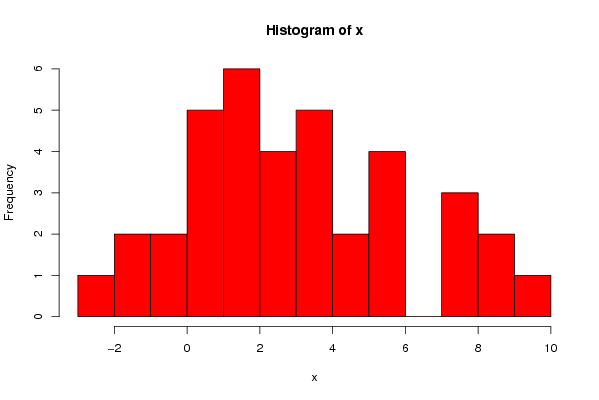
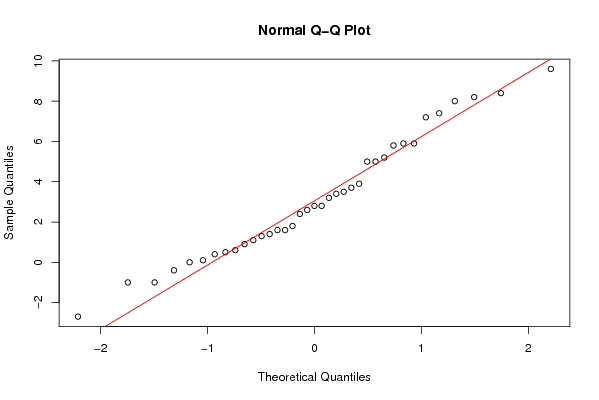
| Title produced by software | Histogram and QQPlot (Reddy-Moores Data) | |||||||||||||||||||||||||||||
| Date of computation | Wed, 02 Jun 2010 09:48:53 +0000 | |||||||||||||||||||||||||||||
| Cite this page as follows | Statistical Computations at FreeStatistics.org, Office for Research Development and Education, URL https://freestatistics.org/blog/index.php?v=date/2010/Jun/02/t1275472231znvgkatykt5dvx3.htm/, Retrieved Fri, 19 Apr 2024 16:57:44 +0000 | |||||||||||||||||||||||||||||
| Statistical Computations at FreeStatistics.org, Office for Research Development and Education, URL https://freestatistics.org/blog/index.php?pk=77077, Retrieved Fri, 19 Apr 2024 16:57:44 +0000 | ||||||||||||||||||||||||||||||
| QR Codes: | ||||||||||||||||||||||||||||||
|
| ||||||||||||||||||||||||||||||
| Original text written by user: | ||||||||||||||||||||||||||||||
| IsPrivate? | No (this computation is public) | |||||||||||||||||||||||||||||
| User-defined keywords | ||||||||||||||||||||||||||||||
| Estimated Impact | 133 | |||||||||||||||||||||||||||||
Tree of Dependent Computations | ||||||||||||||||||||||||||||||
| Family? (F = Feedback message, R = changed R code, M = changed R Module, P = changed Parameters, D = changed Data) | ||||||||||||||||||||||||||||||
| - [Two-Way ANOVA] [two-way anova wit...] [2010-05-26 17:02:24] [98fd0e87c3eb04e0cc2efde01dbafab6] - R PD [Two-Way ANOVA] [ANOVA with good l...] [2010-05-28 23:09:47] [98fd0e87c3eb04e0cc2efde01dbafab6] - R [Variability] [ANOVA with better...] [2010-05-29 09:47:12] [98fd0e87c3eb04e0cc2efde01dbafab6] - R [Variability] [ANOVA with better...] [2010-05-29 09:54:40] [98fd0e87c3eb04e0cc2efde01dbafab6] - RMPD [Histogram and QQPlot (Reddy-Moores Data)] [normality histogram] [2010-06-02 09:48:53] [bd77a9fa1de05ff172505362a7bc2d60] [Current] | ||||||||||||||||||||||||||||||
| Feedback Forum | ||||||||||||||||||||||||||||||
Post a new message | ||||||||||||||||||||||||||||||
Dataset | ||||||||||||||||||||||||||||||
| Dataseries X: | ||||||||||||||||||||||||||||||
1.1 3.5 -1.0 0.1 0.4 3.7 -0.4 5.9 1.4 0.9 0.6 -1.0 1.6 0.5 -2.7 1.3 5.0 1.6 3.4 1.8 5.2 3.9 2.4 7.2 8.4 8.0 0.0 2.8 8.2 5.0 5.9 3.2 2.6 5.8 2.8 9.6 7.4 | ||||||||||||||||||||||||||||||
Tables (Output of Computation) | ||||||||||||||||||||||||||||||
| ||||||||||||||||||||||||||||||
Figures (Output of Computation) | ||||||||||||||||||||||||||||||
Input Parameters & R Code | ||||||||||||||||||||||||||||||
| Parameters (Session): | ||||||||||||||||||||||||||||||
| par1 = 10 ; | ||||||||||||||||||||||||||||||
| Parameters (R input): | ||||||||||||||||||||||||||||||
| par1 = 10 ; | ||||||||||||||||||||||||||||||
| R code (references can be found in the software module): | ||||||||||||||||||||||||||||||
bitmap(file='test1.png') | ||||||||||||||||||||||||||||||