Free Statistics

of Irreproducible Research!

Author's title

Author*The author of this computation has been verified*
R Software Modulerwasp_Pregnancy and cognition.wasp
Title produced by softwareCorrelation
Date of computationWed, 02 Jun 2010 10:27:19 +0000
Cite this page as followsStatistical Computations at FreeStatistics.org, Office for Research Development and Education, URL https://freestatistics.org/blog/index.php?v=date/2010/Jun/02/t1275474463ho6hz5aovbz3iki.htm/, Retrieved Fri, 19 Apr 2024 06:58:34 +0000
Statistical Computations at FreeStatistics.org, Office for Research Development and Education, URL https://freestatistics.org/blog/index.php?pk=77208, Retrieved Fri, 19 Apr 2024 06:58:34 +0000
QR Codes:

Original text written by user:
IsPrivate?No (this computation is public)
User-defined keywords
Estimated Impact133
Family? (F = Feedback message, R = changed R code, M = changed R Module, P = changed Parameters, D = changed Data)
-     [Two-Way ANOVA] [two-way anova wit...] [2010-05-26 17:02:24] [98fd0e87c3eb04e0cc2efde01dbafab6]
- R PD  [Two-Way ANOVA] [ANOVA with good l...] [2010-05-28 23:09:47] [98fd0e87c3eb04e0cc2efde01dbafab6]
- R       [Variability] [ANOVA with better...] [2010-05-29 09:47:12] [98fd0e87c3eb04e0cc2efde01dbafab6]
- R         [Variability] [ANOVA with better...] [2010-05-29 09:54:40] [98fd0e87c3eb04e0cc2efde01dbafab6]
- RMPD          [Correlation] [] [2010-06-02 10:27:19] [5b58052098f4b0433c56ae9d9a4453be] [Current]
Feedback Forum

Post a new message
Dataseries X:
1.1
3.5
-1.0
0.1
0.4
3.7
-0.4
5.9
1.4
0.9
0.6
-1.0
1.6
0.5
-2.7
1.3
5.0
1.6
3.4
1.8
5.2
3.9
2.4
7.2
8.4
8.0
0.0
2.8
8.2
5.0
5.9
3.2
2.6
5.8
2.8
9.6
7.4
Dataseries Y:
1.1
3.5
-1.0
0.1
0.4
3.7
-0.4
5.9
1.4
0.9
0.6
-1.0
1.6
0.5
-2.7
1.3
5.0
1.6
3.4
1.8
5.2
3.9
2.4
7.2
8.4
8.0
0.0
2.8
8.2
5.0
5.9
3.2
2.6
5.8
2.8
9.6
7.4


Summary of computational transaction
Raw Inputview raw input (R code)
Raw Outputview raw output of R engine
Computing time2 seconds
R Server'George Udny Yule' @ 72.249.76.132

\begin{tabular}{lllllllll}
\hline
Summary of computational transaction \tabularnewline
Raw Input & view raw input (R code)  \tabularnewline
Raw Output & view raw output of R engine  \tabularnewline
Computing time & 2 seconds \tabularnewline
R Server & 'George Udny Yule' @ 72.249.76.132 \tabularnewline
\hline
\end{tabular}
%Source: https://freestatistics.org/blog/index.php?pk=77208&T=0

[TABLE]
[ROW][C]Summary of computational transaction[/C][/ROW]
[ROW][C]Raw Input[/C][C]view raw input (R code) [/C][/ROW]
[ROW][C]Raw Output[/C][C]view raw output of R engine [/C][/ROW]
[ROW][C]Computing time[/C][C]2 seconds[/C][/ROW]
[ROW][C]R Server[/C][C]'George Udny Yule' @ 72.249.76.132[/C][/ROW]
[/TABLE]
Source: https://freestatistics.org/blog/index.php?pk=77208&T=0

Globally Unique Identifier (entire table): ba.freestatistics.org/blog/index.php?pk=77208&T=0

As an alternative you can also use a QR Code:  

The GUIDs for individual cells are displayed in the table below:

Summary of computational transaction
Raw Inputview raw input (R code)
Raw Outputview raw output of R engine
Computing time2 seconds
R Server'George Udny Yule' @ 72.249.76.132


Shapiro Test (compmemomean)
Statistic WProbabilityLink
0.96930.3908Shapiro-Wilk Test

\begin{tabular}{lllllllll}
\hline
Shapiro Test (compmemomean) \tabularnewline
Statistic W & Probability & Link \tabularnewline
0.9693 & 0.3908 & Shapiro-Wilk Test \tabularnewline
\hline
\end{tabular}
%Source: https://freestatistics.org/blog/index.php?pk=77208&T=1

[TABLE]
[ROW][C]Shapiro Test (compmemomean)[/C][/ROW]
[ROW][C]Statistic W[/C][C]Probability[/C][C]Link[/C][/ROW]
[ROW][C]0.9693[/C][C]0.3908[/C][C]Shapiro-Wilk Test[/C][/ROW]
[/TABLE]
Source: https://freestatistics.org/blog/index.php?pk=77208&T=1

Globally Unique Identifier (entire table): ba.freestatistics.org/blog/index.php?pk=77208&T=1

As an alternative you can also use a QR Code:  

The GUIDs for individual cells are displayed in the table below:

Shapiro Test (compmemomean)
Statistic WProbabilityLink
0.96930.3908Shapiro-Wilk Test


Shapiro Test (specmemmean)
Statistic WprobabilityLink
0.96930.3908Shapiro-Wilk Test

\begin{tabular}{lllllllll}
\hline
Shapiro Test (specmemmean) \tabularnewline
Statistic W & probability & Link \tabularnewline
0.9693 & 0.3908 & Shapiro-Wilk Test \tabularnewline
\hline
\end{tabular}
%Source: https://freestatistics.org/blog/index.php?pk=77208&T=2

[TABLE]
[ROW][C]Shapiro Test (specmemmean)[/C][/ROW]
[ROW][C]Statistic W[/C][C]probability[/C][C]Link[/C][/ROW]
[ROW][C]0.9693[/C][C]0.3908[/C][C]Shapiro-Wilk Test[/C][/ROW]
[/TABLE]
Source: https://freestatistics.org/blog/index.php?pk=77208&T=2

Globally Unique Identifier (entire table): ba.freestatistics.org/blog/index.php?pk=77208&T=2

As an alternative you can also use a QR Code:  

The GUIDs for individual cells are displayed in the table below:

Shapiro Test (specmemmean)
Statistic WprobabilityLink
0.96930.3908Shapiro-Wilk Test


Correlation Test X-Y
StatisticValueprobabilityMethodalternative
cor10Pearson's product-moment correlationtwo.sided

\begin{tabular}{lllllllll}
\hline
Correlation Test X-Y \tabularnewline
Statistic & Value & probability & Method & alternative \tabularnewline
cor & 1 & 0 & Pearson's product-moment correlation & two.sided \tabularnewline
\hline
\end{tabular}
%Source: https://freestatistics.org/blog/index.php?pk=77208&T=3

[TABLE]
[ROW][C]Correlation Test X-Y[/C][/ROW]
[ROW][C]Statistic[/C][C]Value[/C][C]probability[/C][C]Method[/C][C]alternative[/C][/ROW]
[ROW][C]cor[/C][C]1[/C][C]0[/C][C]Pearson's product-moment correlation[/C][C]two.sided[/C][/ROW]
[/TABLE]
Source: https://freestatistics.org/blog/index.php?pk=77208&T=3

Globally Unique Identifier (entire table): ba.freestatistics.org/blog/index.php?pk=77208&T=3

As an alternative you can also use a QR Code:  

The GUIDs for individual cells are displayed in the table below:

Correlation Test X-Y
StatisticValueprobabilityMethodalternative
cor10Pearson's product-moment correlationtwo.sided


Parameters (Session):
par1 = less ; par2 = 1 ; par3 = 2 ; par4 = T-Test ; par5 = unpaired ; par6 = 0.0 ; par7 = 0.95 ; par8 = TRUE ;
Parameters (R input):
par1 = pearson ; par2 = two.sided ;
R code (references can be found in the software module):
bitmap(file='test1.png')
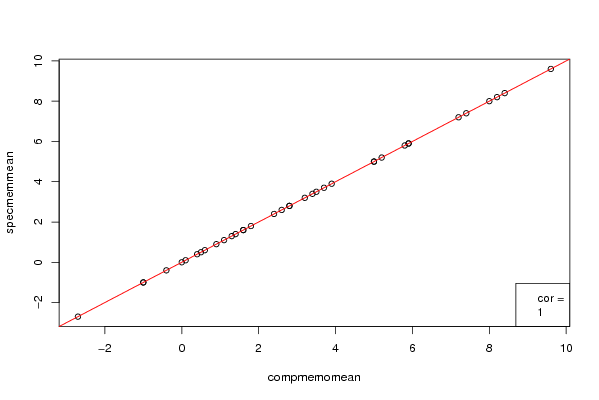
plot(x,y, xlab=xlab, ylab=ylab)
abline(coef=(lm(y ~ x))$coeff, col='red')
ctp<-cor.test(x, y, use='pair', method='pearson')
legend('bottomright', c('cor =', as.character(round(ctp$estimate, digits=4))))
dev.off()
(sw1<-shapiro.test(x))
(sw2<-shapiro.test(y))
(cxy<-cor.test(x, y, method=par1))
load(file='createtable')
a<-table.start()
a<-table.row.start(a)
a<-table.element(a,paste('Shapiro Test (', xlab,')',sep=''),3,TRUE)
a<-table.row.end(a)
a<-table.row.start(a)
a<-table.element(a,'Statistic W',header=TRUE)
a<-table.element(a,'Probability',header=TRUE)
a<-table.element(a,'Link',header=TRUE)
a<-table.row.end(a)
a<-table.row.start(a)
a<-table.element(a,round(sw1$statistic, digits=4))
a<-table.element(a,round(sw1$p.value, digits=4))
a<-table.element(a,hyperlink('http://en.wikipedia.org/wiki/Shapiro%E2%80%93Wilk_test','Shapiro-Wilk Test','Shapiro-Wilk Test'))
a<-table.row.end(a)
a<-table.end(a)
table.save(a,file='mytable.tab')
a<-table.start()
a<-table.row.start(a)
a<-table.element(a, paste('Shapiro Test (', ylab,')',sep=''),3,TRUE)
a<-table.row.end(a)
a<-table.row.start(a)
a<-table.element(a,'Statistic W',header=TRUE)
a<-table.element(a,'probability',header=TRUE)
a<-table.element(a,'Link',header=TRUE)
a<-table.row.end(a)
a<-table.row.start(a)
a<-table.element(a,round(sw2$statistic, digits=4))
a<-table.element(a,round(sw2$p.value, digits=4))
a<-table.element(a,hyperlink('http://en.wikipedia.org/wiki/Shapiro%E2%80%93Wilk_test','Shapiro-Wilk Test','Shapiro-Wilk Test'))
a<-table.row.end(a)
a<-table.end(a)
table.save(a,file='mytable1.tab')
a<-table.start()
a<-table.row.start(a)
a<-table.element(a,'Correlation Test X-Y',5,TRUE)
a<-table.row.end(a)
a<-table.row.start(a)
a<-table.element(a,'Statistic',header=TRUE)
a<-table.element(a,'Value',header=TRUE)
a<-table.element(a,'probability',header=TRUE)
a<-table.element(a,'Method',header=TRUE)
a<-table.element(a,'alternative',header=TRUE)
a<-table.row.end(a)
a<-table.row.start(a)
a<-table.element(a,names(cxy$estimate))
a<-table.element(a,round(cxy$estimate, digits=4))
a<-table.element(a,round(cxy$p.value, digits=4))
a<-table.element(a,cxy$method)
a<-table.element(a,cxy$alternative)
a<-table.row.end(a)
a<-table.end(a)
table.save(a,file='mytable2.tab')