Free Statistics

of Irreproducible Research!

Author's title

Author*Unverified author*
R Software Modulerwasp_autocorrelation.wasp
Title produced by software(Partial) Autocorrelation Function
Date of computationMon, 03 May 2010 12:42:39 +0000
Cite this page as followsStatistical Computations at FreeStatistics.org, Office for Research Development and Education, URL https://freestatistics.org/blog/index.php?v=date/2010/May/03/t1272890719kw2vhco5u2ac0av.htm/, Retrieved Fri, 19 Apr 2024 00:04:33 +0000
Statistical Computations at FreeStatistics.org, Office for Research Development and Education, URL https://freestatistics.org/blog/index.php?pk=75194, Retrieved Fri, 19 Apr 2024 00:04:33 +0000
QR Codes:

Original text written by user:
IsPrivate?No (this computation is public)
User-defined keywordsKDGP2W21
Estimated Impact168
Family? (F = Feedback message, R = changed R code, M = changed R Module, P = changed Parameters, D = changed Data)
-       [(Partial) Autocorrelation Function] [Inschrijvingen ni...] [2010-05-03 12:42:39] [6248cd2b0d0af288003213c4deab0003] [Current]
Feedback Forum

Post a new message
Dataseries X:
41086
39690
43129
37863
35953
29133
24693
22205
21725
27192
21790
13253
37702
30364
32609
30212
29965
28352
25814
22414
20506
28806
22228
13971
36845
35338
35022
34777
26887
23970
22780
17351
21382
24561
17409
11514
31514
27071
29462
26105
22397
23843
21705
18089
20764
25316
17704
15548
28029
29383
36438
32034
22679
24319
18004
17537
20366
22782
19169
13807
29743
25591
29096
26482
22405
27044
17970
18730
19684
19785
18479
10698


Summary of computational transaction
Raw Inputview raw input (R code)
Raw Outputview raw output of R engine
Computing time1 seconds
R Server'George Udny Yule' @ 72.249.76.132

\begin{tabular}{lllllllll}
\hline
Summary of computational transaction \tabularnewline
Raw Input & view raw input (R code)  \tabularnewline
Raw Output & view raw output of R engine  \tabularnewline
Computing time & 1 seconds \tabularnewline
R Server & 'George Udny Yule' @ 72.249.76.132 \tabularnewline
\hline
\end{tabular}
%Source: https://freestatistics.org/blog/index.php?pk=75194&T=0

[TABLE]
[ROW][C]Summary of computational transaction[/C][/ROW]
[ROW][C]Raw Input[/C][C]view raw input (R code) [/C][/ROW]
[ROW][C]Raw Output[/C][C]view raw output of R engine [/C][/ROW]
[ROW][C]Computing time[/C][C]1 seconds[/C][/ROW]
[ROW][C]R Server[/C][C]'George Udny Yule' @ 72.249.76.132[/C][/ROW]
[/TABLE]
Source: https://freestatistics.org/blog/index.php?pk=75194&T=0

Globally Unique Identifier (entire table): ba.freestatistics.org/blog/index.php?pk=75194&T=0

As an alternative you can also use a QR Code:  

The GUIDs for individual cells are displayed in the table below:

Summary of computational transaction
Raw Inputview raw input (R code)
Raw Outputview raw output of R engine
Computing time1 seconds
R Server'George Udny Yule' @ 72.249.76.132


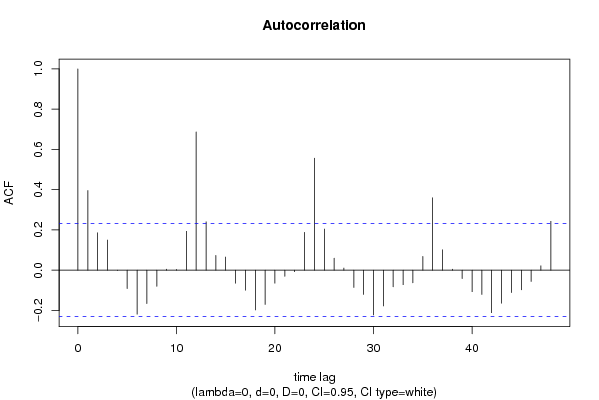
Autocorrelation Function
Time lag kACF(k)T-STATP-value
10.3959253.35950.000626
20.1859441.57780.059499
30.1498411.27140.103831
4-0.001606-0.01360.494583
5-0.091201-0.77390.220772
6-0.218698-1.85570.033793
7-0.166054-1.4090.081568
8-0.079958-0.67850.249825
90.0048130.04080.483767
100.0034550.02930.488345
110.1933531.64070.052615
120.6871555.83070
130.2404072.03990.022514
140.0730740.62010.268591
150.0654530.55540.290176
16-0.064533-0.54760.292837
17-0.099397-0.84340.200897
18-0.197446-1.67540.049098
19-0.170536-1.4470.076112
20-0.064827-0.55010.291986
21-0.030775-0.26110.397368
22-0.007639-0.06480.47425
230.1878761.59420.057639
240.5566154.7236e-06
250.2045971.73610.043415
260.0593570.50370.308018
270.0106280.09020.464197
28-0.085795-0.7280.234489
29-0.120918-1.0260.154157
30-0.222744-1.890.031389
31-0.177796-1.50870.067882
32-0.082754-0.70220.242412
33-0.072173-0.61240.271098
34-0.063081-0.53530.29706
350.0684180.58050.281679
360.3594593.05010.0016
370.1012610.85920.196533
380.0047120.040.484108
39-0.041644-0.35340.362426
40-0.107168-0.90940.183099
41-0.120339-1.02110.15531
42-0.211537-1.7950.038429
43-0.163795-1.38980.084429
44-0.111188-0.94350.1743
45-0.097553-0.82780.205268
46-0.055731-0.47290.318861
470.0219750.18650.426302
480.2428642.06080.021469

\begin{tabular}{lllllllll}
\hline
Autocorrelation Function \tabularnewline
Time lag k & ACF(k) & T-STAT & P-value \tabularnewline
1 & 0.395925 & 3.3595 & 0.000626 \tabularnewline
2 & 0.185944 & 1.5778 & 0.059499 \tabularnewline
3 & 0.149841 & 1.2714 & 0.103831 \tabularnewline
4 & -0.001606 & -0.0136 & 0.494583 \tabularnewline
5 & -0.091201 & -0.7739 & 0.220772 \tabularnewline
6 & -0.218698 & -1.8557 & 0.033793 \tabularnewline
7 & -0.166054 & -1.409 & 0.081568 \tabularnewline
8 & -0.079958 & -0.6785 & 0.249825 \tabularnewline
9 & 0.004813 & 0.0408 & 0.483767 \tabularnewline
10 & 0.003455 & 0.0293 & 0.488345 \tabularnewline
11 & 0.193353 & 1.6407 & 0.052615 \tabularnewline
12 & 0.687155 & 5.8307 & 0 \tabularnewline
13 & 0.240407 & 2.0399 & 0.022514 \tabularnewline
14 & 0.073074 & 0.6201 & 0.268591 \tabularnewline
15 & 0.065453 & 0.5554 & 0.290176 \tabularnewline
16 & -0.064533 & -0.5476 & 0.292837 \tabularnewline
17 & -0.099397 & -0.8434 & 0.200897 \tabularnewline
18 & -0.197446 & -1.6754 & 0.049098 \tabularnewline
19 & -0.170536 & -1.447 & 0.076112 \tabularnewline
20 & -0.064827 & -0.5501 & 0.291986 \tabularnewline
21 & -0.030775 & -0.2611 & 0.397368 \tabularnewline
22 & -0.007639 & -0.0648 & 0.47425 \tabularnewline
23 & 0.187876 & 1.5942 & 0.057639 \tabularnewline
24 & 0.556615 & 4.723 & 6e-06 \tabularnewline
25 & 0.204597 & 1.7361 & 0.043415 \tabularnewline
26 & 0.059357 & 0.5037 & 0.308018 \tabularnewline
27 & 0.010628 & 0.0902 & 0.464197 \tabularnewline
28 & -0.085795 & -0.728 & 0.234489 \tabularnewline
29 & -0.120918 & -1.026 & 0.154157 \tabularnewline
30 & -0.222744 & -1.89 & 0.031389 \tabularnewline
31 & -0.177796 & -1.5087 & 0.067882 \tabularnewline
32 & -0.082754 & -0.7022 & 0.242412 \tabularnewline
33 & -0.072173 & -0.6124 & 0.271098 \tabularnewline
34 & -0.063081 & -0.5353 & 0.29706 \tabularnewline
35 & 0.068418 & 0.5805 & 0.281679 \tabularnewline
36 & 0.359459 & 3.0501 & 0.0016 \tabularnewline
37 & 0.101261 & 0.8592 & 0.196533 \tabularnewline
38 & 0.004712 & 0.04 & 0.484108 \tabularnewline
39 & -0.041644 & -0.3534 & 0.362426 \tabularnewline
40 & -0.107168 & -0.9094 & 0.183099 \tabularnewline
41 & -0.120339 & -1.0211 & 0.15531 \tabularnewline
42 & -0.211537 & -1.795 & 0.038429 \tabularnewline
43 & -0.163795 & -1.3898 & 0.084429 \tabularnewline
44 & -0.111188 & -0.9435 & 0.1743 \tabularnewline
45 & -0.097553 & -0.8278 & 0.205268 \tabularnewline
46 & -0.055731 & -0.4729 & 0.318861 \tabularnewline
47 & 0.021975 & 0.1865 & 0.426302 \tabularnewline
48 & 0.242864 & 2.0608 & 0.021469 \tabularnewline
\hline
\end{tabular}
%Source: https://freestatistics.org/blog/index.php?pk=75194&T=1

[TABLE]
[ROW][C]Autocorrelation Function[/C][/ROW]
[ROW][C]Time lag k[/C][C]ACF(k)[/C][C]T-STAT[/C][C]P-value[/C][/ROW]
[ROW][C]1[/C][C]0.395925[/C][C]3.3595[/C][C]0.000626[/C][/ROW]
[ROW][C]2[/C][C]0.185944[/C][C]1.5778[/C][C]0.059499[/C][/ROW]
[ROW][C]3[/C][C]0.149841[/C][C]1.2714[/C][C]0.103831[/C][/ROW]
[ROW][C]4[/C][C]-0.001606[/C][C]-0.0136[/C][C]0.494583[/C][/ROW]
[ROW][C]5[/C][C]-0.091201[/C][C]-0.7739[/C][C]0.220772[/C][/ROW]
[ROW][C]6[/C][C]-0.218698[/C][C]-1.8557[/C][C]0.033793[/C][/ROW]
[ROW][C]7[/C][C]-0.166054[/C][C]-1.409[/C][C]0.081568[/C][/ROW]
[ROW][C]8[/C][C]-0.079958[/C][C]-0.6785[/C][C]0.249825[/C][/ROW]
[ROW][C]9[/C][C]0.004813[/C][C]0.0408[/C][C]0.483767[/C][/ROW]
[ROW][C]10[/C][C]0.003455[/C][C]0.0293[/C][C]0.488345[/C][/ROW]
[ROW][C]11[/C][C]0.193353[/C][C]1.6407[/C][C]0.052615[/C][/ROW]
[ROW][C]12[/C][C]0.687155[/C][C]5.8307[/C][C]0[/C][/ROW]
[ROW][C]13[/C][C]0.240407[/C][C]2.0399[/C][C]0.022514[/C][/ROW]
[ROW][C]14[/C][C]0.073074[/C][C]0.6201[/C][C]0.268591[/C][/ROW]
[ROW][C]15[/C][C]0.065453[/C][C]0.5554[/C][C]0.290176[/C][/ROW]
[ROW][C]16[/C][C]-0.064533[/C][C]-0.5476[/C][C]0.292837[/C][/ROW]
[ROW][C]17[/C][C]-0.099397[/C][C]-0.8434[/C][C]0.200897[/C][/ROW]
[ROW][C]18[/C][C]-0.197446[/C][C]-1.6754[/C][C]0.049098[/C][/ROW]
[ROW][C]19[/C][C]-0.170536[/C][C]-1.447[/C][C]0.076112[/C][/ROW]
[ROW][C]20[/C][C]-0.064827[/C][C]-0.5501[/C][C]0.291986[/C][/ROW]
[ROW][C]21[/C][C]-0.030775[/C][C]-0.2611[/C][C]0.397368[/C][/ROW]
[ROW][C]22[/C][C]-0.007639[/C][C]-0.0648[/C][C]0.47425[/C][/ROW]
[ROW][C]23[/C][C]0.187876[/C][C]1.5942[/C][C]0.057639[/C][/ROW]
[ROW][C]24[/C][C]0.556615[/C][C]4.723[/C][C]6e-06[/C][/ROW]
[ROW][C]25[/C][C]0.204597[/C][C]1.7361[/C][C]0.043415[/C][/ROW]
[ROW][C]26[/C][C]0.059357[/C][C]0.5037[/C][C]0.308018[/C][/ROW]
[ROW][C]27[/C][C]0.010628[/C][C]0.0902[/C][C]0.464197[/C][/ROW]
[ROW][C]28[/C][C]-0.085795[/C][C]-0.728[/C][C]0.234489[/C][/ROW]
[ROW][C]29[/C][C]-0.120918[/C][C]-1.026[/C][C]0.154157[/C][/ROW]
[ROW][C]30[/C][C]-0.222744[/C][C]-1.89[/C][C]0.031389[/C][/ROW]
[ROW][C]31[/C][C]-0.177796[/C][C]-1.5087[/C][C]0.067882[/C][/ROW]
[ROW][C]32[/C][C]-0.082754[/C][C]-0.7022[/C][C]0.242412[/C][/ROW]
[ROW][C]33[/C][C]-0.072173[/C][C]-0.6124[/C][C]0.271098[/C][/ROW]
[ROW][C]34[/C][C]-0.063081[/C][C]-0.5353[/C][C]0.29706[/C][/ROW]
[ROW][C]35[/C][C]0.068418[/C][C]0.5805[/C][C]0.281679[/C][/ROW]
[ROW][C]36[/C][C]0.359459[/C][C]3.0501[/C][C]0.0016[/C][/ROW]
[ROW][C]37[/C][C]0.101261[/C][C]0.8592[/C][C]0.196533[/C][/ROW]
[ROW][C]38[/C][C]0.004712[/C][C]0.04[/C][C]0.484108[/C][/ROW]
[ROW][C]39[/C][C]-0.041644[/C][C]-0.3534[/C][C]0.362426[/C][/ROW]
[ROW][C]40[/C][C]-0.107168[/C][C]-0.9094[/C][C]0.183099[/C][/ROW]
[ROW][C]41[/C][C]-0.120339[/C][C]-1.0211[/C][C]0.15531[/C][/ROW]
[ROW][C]42[/C][C]-0.211537[/C][C]-1.795[/C][C]0.038429[/C][/ROW]
[ROW][C]43[/C][C]-0.163795[/C][C]-1.3898[/C][C]0.084429[/C][/ROW]
[ROW][C]44[/C][C]-0.111188[/C][C]-0.9435[/C][C]0.1743[/C][/ROW]
[ROW][C]45[/C][C]-0.097553[/C][C]-0.8278[/C][C]0.205268[/C][/ROW]
[ROW][C]46[/C][C]-0.055731[/C][C]-0.4729[/C][C]0.318861[/C][/ROW]
[ROW][C]47[/C][C]0.021975[/C][C]0.1865[/C][C]0.426302[/C][/ROW]
[ROW][C]48[/C][C]0.242864[/C][C]2.0608[/C][C]0.021469[/C][/ROW]
[/TABLE]
Source: https://freestatistics.org/blog/index.php?pk=75194&T=1

Globally Unique Identifier (entire table): ba.freestatistics.org/blog/index.php?pk=75194&T=1

As an alternative you can also use a QR Code:  

The GUIDs for individual cells are displayed in the table below:

Autocorrelation Function
Time lag kACF(k)T-STATP-value
10.3959253.35950.000626
20.1859441.57780.059499
30.1498411.27140.103831
4-0.001606-0.01360.494583
5-0.091201-0.77390.220772
6-0.218698-1.85570.033793
7-0.166054-1.4090.081568
8-0.079958-0.67850.249825
90.0048130.04080.483767
100.0034550.02930.488345
110.1933531.64070.052615
120.6871555.83070
130.2404072.03990.022514
140.0730740.62010.268591
150.0654530.55540.290176
16-0.064533-0.54760.292837
17-0.099397-0.84340.200897
18-0.197446-1.67540.049098
19-0.170536-1.4470.076112
20-0.064827-0.55010.291986
21-0.030775-0.26110.397368
22-0.007639-0.06480.47425
230.1878761.59420.057639
240.5566154.7236e-06
250.2045971.73610.043415
260.0593570.50370.308018
270.0106280.09020.464197
28-0.085795-0.7280.234489
29-0.120918-1.0260.154157
30-0.222744-1.890.031389
31-0.177796-1.50870.067882
32-0.082754-0.70220.242412
33-0.072173-0.61240.271098
34-0.063081-0.53530.29706
350.0684180.58050.281679
360.3594593.05010.0016
370.1012610.85920.196533
380.0047120.040.484108
39-0.041644-0.35340.362426
40-0.107168-0.90940.183099
41-0.120339-1.02110.15531
42-0.211537-1.7950.038429
43-0.163795-1.38980.084429
44-0.111188-0.94350.1743
45-0.097553-0.82780.205268
46-0.055731-0.47290.318861
470.0219750.18650.426302
480.2428642.06080.021469


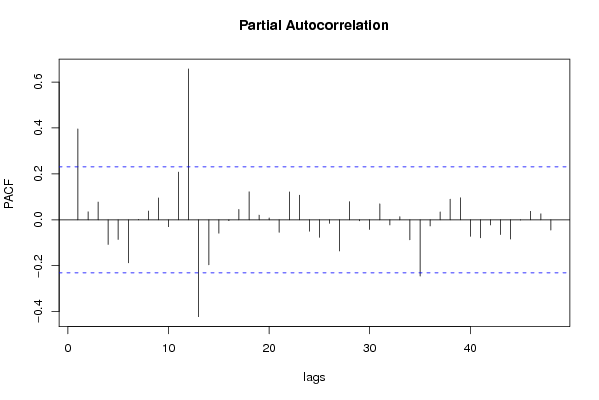
Partial Autocorrelation Function
Time lag kPACF(k)T-STATP-value
10.3959253.35950.000626
20.0346130.29370.384915
30.0772530.65550.257113
4-0.107512-0.91230.182336
5-0.085565-0.7260.235083
6-0.187717-1.59280.057789
70.0016940.01440.494285
80.0377970.32070.374677
90.0953140.80880.210658
10-0.030082-0.25530.399627
110.2076481.7620.041161
120.657155.57610
13-0.422048-3.58120.000309
14-0.196207-1.66490.050142
15-0.058184-0.49370.311509
16-0.00423-0.03590.485734
170.045040.38220.351729
180.1219021.03440.152212
190.0203080.17230.431835
200.007960.06750.473167
21-0.054471-0.46220.322666
220.1215111.03110.152984
230.1069220.90730.183648
24-0.04993-0.42370.336535
25-0.076194-0.64650.259998
26-0.015569-0.13210.447635
27-0.135657-1.15110.126752
280.0786180.66710.253421
29-0.004449-0.03780.484995
30-0.042193-0.3580.360689
310.0693260.58830.279102
32-0.022262-0.18890.425353
330.0132910.11280.455261
34-0.087318-0.74090.230576
35-0.245001-2.07890.020595
36-0.02708-0.22980.409457
370.0339610.28820.387023
380.0897770.76180.224338
390.0956210.81140.209914
40-0.071883-0.60990.271909
41-0.078423-0.66540.253947
42-0.022395-0.190.42491
43-0.064208-0.54480.293781
44-0.083963-0.71240.239245
45-0.001175-0.010.496037
460.0367810.31210.377934
470.0258220.21910.413594
48-0.044887-0.38090.352207

\begin{tabular}{lllllllll}
\hline
Partial Autocorrelation Function \tabularnewline
Time lag k & PACF(k) & T-STAT & P-value \tabularnewline
1 & 0.395925 & 3.3595 & 0.000626 \tabularnewline
2 & 0.034613 & 0.2937 & 0.384915 \tabularnewline
3 & 0.077253 & 0.6555 & 0.257113 \tabularnewline
4 & -0.107512 & -0.9123 & 0.182336 \tabularnewline
5 & -0.085565 & -0.726 & 0.235083 \tabularnewline
6 & -0.187717 & -1.5928 & 0.057789 \tabularnewline
7 & 0.001694 & 0.0144 & 0.494285 \tabularnewline
8 & 0.037797 & 0.3207 & 0.374677 \tabularnewline
9 & 0.095314 & 0.8088 & 0.210658 \tabularnewline
10 & -0.030082 & -0.2553 & 0.399627 \tabularnewline
11 & 0.207648 & 1.762 & 0.041161 \tabularnewline
12 & 0.65715 & 5.5761 & 0 \tabularnewline
13 & -0.422048 & -3.5812 & 0.000309 \tabularnewline
14 & -0.196207 & -1.6649 & 0.050142 \tabularnewline
15 & -0.058184 & -0.4937 & 0.311509 \tabularnewline
16 & -0.00423 & -0.0359 & 0.485734 \tabularnewline
17 & 0.04504 & 0.3822 & 0.351729 \tabularnewline
18 & 0.121902 & 1.0344 & 0.152212 \tabularnewline
19 & 0.020308 & 0.1723 & 0.431835 \tabularnewline
20 & 0.00796 & 0.0675 & 0.473167 \tabularnewline
21 & -0.054471 & -0.4622 & 0.322666 \tabularnewline
22 & 0.121511 & 1.0311 & 0.152984 \tabularnewline
23 & 0.106922 & 0.9073 & 0.183648 \tabularnewline
24 & -0.04993 & -0.4237 & 0.336535 \tabularnewline
25 & -0.076194 & -0.6465 & 0.259998 \tabularnewline
26 & -0.015569 & -0.1321 & 0.447635 \tabularnewline
27 & -0.135657 & -1.1511 & 0.126752 \tabularnewline
28 & 0.078618 & 0.6671 & 0.253421 \tabularnewline
29 & -0.004449 & -0.0378 & 0.484995 \tabularnewline
30 & -0.042193 & -0.358 & 0.360689 \tabularnewline
31 & 0.069326 & 0.5883 & 0.279102 \tabularnewline
32 & -0.022262 & -0.1889 & 0.425353 \tabularnewline
33 & 0.013291 & 0.1128 & 0.455261 \tabularnewline
34 & -0.087318 & -0.7409 & 0.230576 \tabularnewline
35 & -0.245001 & -2.0789 & 0.020595 \tabularnewline
36 & -0.02708 & -0.2298 & 0.409457 \tabularnewline
37 & 0.033961 & 0.2882 & 0.387023 \tabularnewline
38 & 0.089777 & 0.7618 & 0.224338 \tabularnewline
39 & 0.095621 & 0.8114 & 0.209914 \tabularnewline
40 & -0.071883 & -0.6099 & 0.271909 \tabularnewline
41 & -0.078423 & -0.6654 & 0.253947 \tabularnewline
42 & -0.022395 & -0.19 & 0.42491 \tabularnewline
43 & -0.064208 & -0.5448 & 0.293781 \tabularnewline
44 & -0.083963 & -0.7124 & 0.239245 \tabularnewline
45 & -0.001175 & -0.01 & 0.496037 \tabularnewline
46 & 0.036781 & 0.3121 & 0.377934 \tabularnewline
47 & 0.025822 & 0.2191 & 0.413594 \tabularnewline
48 & -0.044887 & -0.3809 & 0.352207 \tabularnewline
\hline
\end{tabular}
%Source: https://freestatistics.org/blog/index.php?pk=75194&T=2

[TABLE]
[ROW][C]Partial Autocorrelation Function[/C][/ROW]
[ROW][C]Time lag k[/C][C]PACF(k)[/C][C]T-STAT[/C][C]P-value[/C][/ROW]
[ROW][C]1[/C][C]0.395925[/C][C]3.3595[/C][C]0.000626[/C][/ROW]
[ROW][C]2[/C][C]0.034613[/C][C]0.2937[/C][C]0.384915[/C][/ROW]
[ROW][C]3[/C][C]0.077253[/C][C]0.6555[/C][C]0.257113[/C][/ROW]
[ROW][C]4[/C][C]-0.107512[/C][C]-0.9123[/C][C]0.182336[/C][/ROW]
[ROW][C]5[/C][C]-0.085565[/C][C]-0.726[/C][C]0.235083[/C][/ROW]
[ROW][C]6[/C][C]-0.187717[/C][C]-1.5928[/C][C]0.057789[/C][/ROW]
[ROW][C]7[/C][C]0.001694[/C][C]0.0144[/C][C]0.494285[/C][/ROW]
[ROW][C]8[/C][C]0.037797[/C][C]0.3207[/C][C]0.374677[/C][/ROW]
[ROW][C]9[/C][C]0.095314[/C][C]0.8088[/C][C]0.210658[/C][/ROW]
[ROW][C]10[/C][C]-0.030082[/C][C]-0.2553[/C][C]0.399627[/C][/ROW]
[ROW][C]11[/C][C]0.207648[/C][C]1.762[/C][C]0.041161[/C][/ROW]
[ROW][C]12[/C][C]0.65715[/C][C]5.5761[/C][C]0[/C][/ROW]
[ROW][C]13[/C][C]-0.422048[/C][C]-3.5812[/C][C]0.000309[/C][/ROW]
[ROW][C]14[/C][C]-0.196207[/C][C]-1.6649[/C][C]0.050142[/C][/ROW]
[ROW][C]15[/C][C]-0.058184[/C][C]-0.4937[/C][C]0.311509[/C][/ROW]
[ROW][C]16[/C][C]-0.00423[/C][C]-0.0359[/C][C]0.485734[/C][/ROW]
[ROW][C]17[/C][C]0.04504[/C][C]0.3822[/C][C]0.351729[/C][/ROW]
[ROW][C]18[/C][C]0.121902[/C][C]1.0344[/C][C]0.152212[/C][/ROW]
[ROW][C]19[/C][C]0.020308[/C][C]0.1723[/C][C]0.431835[/C][/ROW]
[ROW][C]20[/C][C]0.00796[/C][C]0.0675[/C][C]0.473167[/C][/ROW]
[ROW][C]21[/C][C]-0.054471[/C][C]-0.4622[/C][C]0.322666[/C][/ROW]
[ROW][C]22[/C][C]0.121511[/C][C]1.0311[/C][C]0.152984[/C][/ROW]
[ROW][C]23[/C][C]0.106922[/C][C]0.9073[/C][C]0.183648[/C][/ROW]
[ROW][C]24[/C][C]-0.04993[/C][C]-0.4237[/C][C]0.336535[/C][/ROW]
[ROW][C]25[/C][C]-0.076194[/C][C]-0.6465[/C][C]0.259998[/C][/ROW]
[ROW][C]26[/C][C]-0.015569[/C][C]-0.1321[/C][C]0.447635[/C][/ROW]
[ROW][C]27[/C][C]-0.135657[/C][C]-1.1511[/C][C]0.126752[/C][/ROW]
[ROW][C]28[/C][C]0.078618[/C][C]0.6671[/C][C]0.253421[/C][/ROW]
[ROW][C]29[/C][C]-0.004449[/C][C]-0.0378[/C][C]0.484995[/C][/ROW]
[ROW][C]30[/C][C]-0.042193[/C][C]-0.358[/C][C]0.360689[/C][/ROW]
[ROW][C]31[/C][C]0.069326[/C][C]0.5883[/C][C]0.279102[/C][/ROW]
[ROW][C]32[/C][C]-0.022262[/C][C]-0.1889[/C][C]0.425353[/C][/ROW]
[ROW][C]33[/C][C]0.013291[/C][C]0.1128[/C][C]0.455261[/C][/ROW]
[ROW][C]34[/C][C]-0.087318[/C][C]-0.7409[/C][C]0.230576[/C][/ROW]
[ROW][C]35[/C][C]-0.245001[/C][C]-2.0789[/C][C]0.020595[/C][/ROW]
[ROW][C]36[/C][C]-0.02708[/C][C]-0.2298[/C][C]0.409457[/C][/ROW]
[ROW][C]37[/C][C]0.033961[/C][C]0.2882[/C][C]0.387023[/C][/ROW]
[ROW][C]38[/C][C]0.089777[/C][C]0.7618[/C][C]0.224338[/C][/ROW]
[ROW][C]39[/C][C]0.095621[/C][C]0.8114[/C][C]0.209914[/C][/ROW]
[ROW][C]40[/C][C]-0.071883[/C][C]-0.6099[/C][C]0.271909[/C][/ROW]
[ROW][C]41[/C][C]-0.078423[/C][C]-0.6654[/C][C]0.253947[/C][/ROW]
[ROW][C]42[/C][C]-0.022395[/C][C]-0.19[/C][C]0.42491[/C][/ROW]
[ROW][C]43[/C][C]-0.064208[/C][C]-0.5448[/C][C]0.293781[/C][/ROW]
[ROW][C]44[/C][C]-0.083963[/C][C]-0.7124[/C][C]0.239245[/C][/ROW]
[ROW][C]45[/C][C]-0.001175[/C][C]-0.01[/C][C]0.496037[/C][/ROW]
[ROW][C]46[/C][C]0.036781[/C][C]0.3121[/C][C]0.377934[/C][/ROW]
[ROW][C]47[/C][C]0.025822[/C][C]0.2191[/C][C]0.413594[/C][/ROW]
[ROW][C]48[/C][C]-0.044887[/C][C]-0.3809[/C][C]0.352207[/C][/ROW]
[/TABLE]
Source: https://freestatistics.org/blog/index.php?pk=75194&T=2

Globally Unique Identifier (entire table): ba.freestatistics.org/blog/index.php?pk=75194&T=2

As an alternative you can also use a QR Code:  

The GUIDs for individual cells are displayed in the table below:

Partial Autocorrelation Function
Time lag kPACF(k)T-STATP-value
10.3959253.35950.000626
20.0346130.29370.384915
30.0772530.65550.257113
4-0.107512-0.91230.182336
5-0.085565-0.7260.235083
6-0.187717-1.59280.057789
70.0016940.01440.494285
80.0377970.32070.374677
90.0953140.80880.210658
10-0.030082-0.25530.399627
110.2076481.7620.041161
120.657155.57610
13-0.422048-3.58120.000309
14-0.196207-1.66490.050142
15-0.058184-0.49370.311509
16-0.00423-0.03590.485734
170.045040.38220.351729
180.1219021.03440.152212
190.0203080.17230.431835
200.007960.06750.473167
21-0.054471-0.46220.322666
220.1215111.03110.152984
230.1069220.90730.183648
24-0.04993-0.42370.336535
25-0.076194-0.64650.259998
26-0.015569-0.13210.447635
27-0.135657-1.15110.126752
280.0786180.66710.253421
29-0.004449-0.03780.484995
30-0.042193-0.3580.360689
310.0693260.58830.279102
32-0.022262-0.18890.425353
330.0132910.11280.455261
34-0.087318-0.74090.230576
35-0.245001-2.07890.020595
36-0.02708-0.22980.409457
370.0339610.28820.387023
380.0897770.76180.224338
390.0956210.81140.209914
40-0.071883-0.60990.271909
41-0.078423-0.66540.253947
42-0.022395-0.190.42491
43-0.064208-0.54480.293781
44-0.083963-0.71240.239245
45-0.001175-0.010.496037
460.0367810.31210.377934
470.0258220.21910.413594
48-0.044887-0.38090.352207


Parameters (Session):
par1 = 48 ; par2 = 0.0 ; par3 = 0 ; par4 = 0 ; par5 = 12 ; par6 = White Noise ; par7 = 0.95 ;
Parameters (R input):
par1 = 48 ; par2 = 0.0 ; par3 = 0 ; par4 = 0 ; par5 = 12 ; par6 = White Noise ; par7 = 0.95 ;
R code (references can be found in the software module):
if (par1 == 'Default') {
par1 = 10*log10(length(x))
} else {
par1 <- as.numeric(par1)
}
par2 <- as.numeric(par2)
par3 <- as.numeric(par3)
par4 <- as.numeric(par4)
par5 <- as.numeric(par5)
if (par6 == 'White Noise') par6 <- 'white' else par6 <- 'ma'
par7 <- as.numeric(par7)
if (par2 == 0) {
x <- log(x)
} else {
x <- (x ^ par2 - 1) / par2
}
if (par3 > 0) x <- diff(x,lag=1,difference=par3)
if (par4 > 0) x <- diff(x,lag=par5,difference=par4)
bitmap(file='pic1.png')
racf <- acf(x, par1, main='Autocorrelation', xlab='time lag', ylab='ACF', ci.type=par6, ci=par7, sub=paste('(lambda=',par2,', d=',par3,', D=',par4,', CI=', par7, ', CI type=',par6,')',sep=''))
dev.off()
bitmap(file='pic2.png')
rpacf <- pacf(x,par1,main='Partial Autocorrelation',xlab='lags',ylab='PACF')
dev.off()
(myacf <- c(racf$acf))
(mypacf <- c(rpacf$acf))
lengthx <- length(x)
sqrtn <- sqrt(lengthx)
load(file='createtable')
a<-table.start()
a<-table.row.start(a)
a<-table.element(a,'Autocorrelation Function',4,TRUE)
a<-table.row.end(a)
a<-table.row.start(a)
a<-table.element(a,'Time lag k',header=TRUE)
a<-table.element(a,hyperlink('basics.htm','ACF(k)','click here for more information about the Autocorrelation Function'),header=TRUE)
a<-table.element(a,'T-STAT',header=TRUE)
a<-table.element(a,'P-value',header=TRUE)
a<-table.row.end(a)
for (i in 2:(par1+1)) {
a<-table.row.start(a)
a<-table.element(a,i-1,header=TRUE)
a<-table.element(a,round(myacf[i],6))
mytstat <- myacf[i]*sqrtn
a<-table.element(a,round(mytstat,4))
a<-table.element(a,round(1-pt(abs(mytstat),lengthx),6))
a<-table.row.end(a)
}
a<-table.end(a)
table.save(a,file='mytable.tab')
a<-table.start()
a<-table.row.start(a)
a<-table.element(a,'Partial Autocorrelation Function',4,TRUE)
a<-table.row.end(a)
a<-table.row.start(a)
a<-table.element(a,'Time lag k',header=TRUE)
a<-table.element(a,hyperlink('basics.htm','PACF(k)','click here for more information about the Partial Autocorrelation Function'),header=TRUE)
a<-table.element(a,'T-STAT',header=TRUE)
a<-table.element(a,'P-value',header=TRUE)
a<-table.row.end(a)
for (i in 1:par1) {
a<-table.row.start(a)
a<-table.element(a,i,header=TRUE)
a<-table.element(a,round(mypacf[i],6))
mytstat <- mypacf[i]*sqrtn
a<-table.element(a,round(mytstat,4))
a<-table.element(a,round(1-pt(abs(mytstat),lengthx),6))
a<-table.row.end(a)
}
a<-table.end(a)
table.save(a,file='mytable1.tab')