Free Statistics

of Irreproducible Research!

Author's title

Author*Unverified author*
R Software Modulerwasp_autocorrelation.wasp
Title produced by software(Partial) Autocorrelation Function
Date of computationMon, 03 May 2010 15:07:45 +0000
Cite this page as followsStatistical Computations at FreeStatistics.org, Office for Research Development and Education, URL https://freestatistics.org/blog/index.php?v=date/2010/May/03/t1272899338pkxf7948haoebhb.htm/, Retrieved Sat, 20 Apr 2024 04:31:07 +0000
Statistical Computations at FreeStatistics.org, Office for Research Development and Education, URL https://freestatistics.org/blog/index.php?pk=75221, Retrieved Sat, 20 Apr 2024 04:31:07 +0000
QR Codes:

Original text written by user:
IsPrivate?No (this computation is public)
User-defined keywordsKDGP2W21
Estimated Impact165
Family? (F = Feedback message, R = changed R code, M = changed R Module, P = changed Parameters, D = changed Data)
-       [(Partial) Autocorrelation Function] [] [2010-05-03 15:07:45] [7d0f6047abcd536bf9a7416f4ee4c3aa] [Current]
Feedback Forum

Post a new message
Dataseries X:
93.2
96
95.2
77.1
70.9
64.8
70.1
77.3
79.5
100.6
100.7
107.1
95.9
82.8
83.3
80
80.4
67.5
75.7
71.1
89.3
101.1
105.2
114.1
96.3
84.4
91.2
81.9
80.5
70.4
74.8
75.9
86.3
98.7
100.9
113.8
89.8
84.4
87.2
85.6
72
69.2
77.5
78.1
94.3
97.7
100.2
116.4
97.1
93
96
80.5
76.1
69.9
73.6
92.6
94.2
93.5
108.5
109.4
105.1
92.5
97.1
81.4
79.1
72.1
78.7
87.1
91.4
109.9
116.3
113
100
84.8
94.3
87.1
90.3
72.4
84.9
92.7
92.2
114.9
112.5
118.3
106
91.2
96.6
96.3
88.2
70.2
86.5
88.2
102.8
119.1
119.2
125.1
106.1
102.1
105.2
101
84.3
87.5
92.7
94.4
113
113.9
122.9
132.7
106.9
96.6
127.3
98.2
100.2
89.4
95.3
104.2
106.4
116.2
135.9
134
104.6
107.1
123.5
98.8
98.6
90.6
89.1
105.2
114
122.1
138
142.2
116.4
112.6
123.8
103.6
113.9
98.6
95
116
113.9
127.5
131.4
145.9
131.5
131
130.5
118.9
114.3
85.7
104.6
105.1
117.3
142.5
140
159.8
131.2
125.4
126.5
119.4
113.5
98.7
114.5
113.8
133.1
143.4
137.3
165.2
126.9
124
135.7
130
109.4
117.8
120.3
121
132.3
142.9
147.4
175.9
132.6
123.7
153.3
134
119.6
116.2
118.6
130.7
129.3
144.4
163.2
179.4
128.1
138.4
152.7
120
140.5
116.2
121.4
127.8
143.6
157.6
166.2
182.3
153.1
147.6
157.7
137.2
151.5
98.7
145.8
151.7
129.4
174.1
197
193.9
164.1
142.8
157.9
159.2
162.2
123.1
130
150.1
169.4
179.7
182.1
194.3
161.4
169.4
168.8
158.1
158.5
135.3
149.3
143.4
142.2
188.4
166.2
199.2
182.7
145.2
182.1
158.7
141.6
132.6
139.6
147
166.6
157
180.4
210.2
159.8
157.8
168.2
158.4
152
142.2
137.2
152.6
166.8
165.6
198.6
201.5
170.7
164.4
179.7
157
168
139.3
138.6
153.4
138.9
172.1
198.4
217.8
173.7
153.8
175.6
147.1
160.3
135.2
148.8
151
148.2
182.2
189.2
183.1
170
158.4
176.1
156.2
153.2
117.9
149.8
156.6
166.7
156.8
158.6
210.8
203.6
175.2
168.7
155.9
147.3
137
141.1
167.4
160.2
191.9
174.4
208.2
159.4
161.1
172.1
158.4
114.6
159.6
159.7
159.4
160.7
165.5
205
205.2
141.6
148.1
184.9
132.5
137.3
135.5
121.7
166.1
146.8
162.8
186.8
185.5
151.5
158.1
143
151.2
147.6
130.7
137.5
146.1
133.6
167.9
181.9
202
166.5
151.3
146.2
148.3
144.7
123.6
151.6
133.9
137.4
181.6
182
190
161.2
155.5
141.9
164.6
136.2
126.8
152.5
126.6
150.1
186.3
147.5
200.4
177.2
127.4
177.1
154.4
135.2
126.4
147.3
140.6
152.3
151.2
172.2
215.3
154.1
159.3
160.4
151.9
148.4
139.6
148.2
153.5
145.1
183.7
210.5
203.3
153.3
144.3
169.6
143.7
160.1
135.6
141.8
159.9
145.7
183.5
198.2
186.8
172
150.6
163.3
153.7
152.9
135.5
148.5
148.4
133.6
194.1
208.6
197.3
164.4
148.1
152
144.1
155
124.5
153
146
138
190
192
192
147
133
163
150
129
131
145
137
138
168
176
188
139
143
150
154
137
129
128
140
143
151
177
184
151
134
164
126
131
125
127
143
143
160
190
182
138
136
152
127
151
130
119
153


Summary of computational transaction
Raw Inputview raw input (R code)
Raw Outputview raw output of R engine
Computing time1 seconds
R Server'George Udny Yule' @ 72.249.76.132

\begin{tabular}{lllllllll}
\hline
Summary of computational transaction \tabularnewline
Raw Input & view raw input (R code)  \tabularnewline
Raw Output & view raw output of R engine  \tabularnewline
Computing time & 1 seconds \tabularnewline
R Server & 'George Udny Yule' @ 72.249.76.132 \tabularnewline
\hline
\end{tabular}
%Source: https://freestatistics.org/blog/index.php?pk=75221&T=0

[TABLE]
[ROW][C]Summary of computational transaction[/C][/ROW]
[ROW][C]Raw Input[/C][C]view raw input (R code) [/C][/ROW]
[ROW][C]Raw Output[/C][C]view raw output of R engine [/C][/ROW]
[ROW][C]Computing time[/C][C]1 seconds[/C][/ROW]
[ROW][C]R Server[/C][C]'George Udny Yule' @ 72.249.76.132[/C][/ROW]
[/TABLE]
Source: https://freestatistics.org/blog/index.php?pk=75221&T=0

Globally Unique Identifier (entire table): ba.freestatistics.org/blog/index.php?pk=75221&T=0

As an alternative you can also use a QR Code:  

The GUIDs for individual cells are displayed in the table below:

Summary of computational transaction
Raw Inputview raw input (R code)
Raw Outputview raw output of R engine
Computing time1 seconds
R Server'George Udny Yule' @ 72.249.76.132


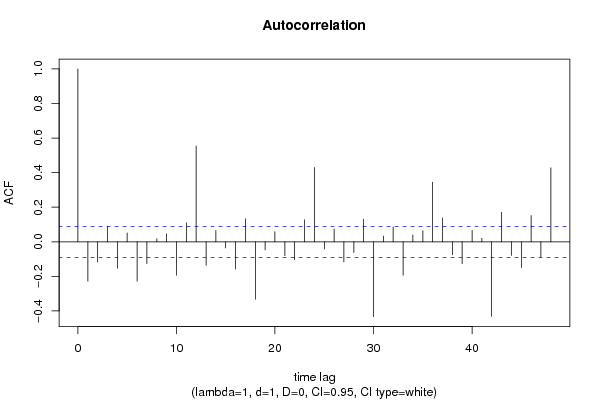
Autocorrelation Function
Time lag kACF(k)T-STATP-value
1-0.227653-4.96160
2-0.116247-2.53360.005806
30.090111.96390.025063
4-0.152634-3.32660.000474
50.0512481.11690.132298
6-0.22773-4.96330
7-0.125648-2.73840.003203
80.0171590.3740.354293
90.0459571.00160.158521
10-0.192958-4.20541.6e-05
110.1097332.39160.008582
120.55355512.06440
13-0.135928-2.96250.001602
140.0653381.4240.077549
15-0.035604-0.7760.219077
16-0.15752-3.43310.000325
170.1339972.92040.001831
18-0.331765-7.23060
19-0.047081-1.02610.15268
200.0586681.27860.100823
21-0.080625-1.75720.039765
22-0.104025-2.26720.011914
230.1269332.76640.002944
240.4297489.36610
25-0.041158-0.8970.18508
260.0737761.60790.05426
27-0.116177-2.5320.005831
28-0.062461-1.36130.087033
290.1306412.84730.0023
30-0.433081-9.43880
310.0329490.71810.236523
320.0850491.85360.032209
33-0.19384-4.22471.4e-05
340.0394940.86080.194902
350.0636841.3880.0829
360.3446877.51230
370.1383563.01540.001352
38-0.074757-1.62930.051958
39-0.127082-2.76970.002915
400.0660221.43890.075415
410.0202960.44230.329221
42-0.431767-9.41010
430.1704723.71530.000114
44-0.078896-1.71950.043087
45-0.149368-3.25540.000607
460.1515943.30390.000513
47-0.089546-1.95160.025786
480.4277399.32240

\begin{tabular}{lllllllll}
\hline
Autocorrelation Function \tabularnewline
Time lag k & ACF(k) & T-STAT & P-value \tabularnewline
1 & -0.227653 & -4.9616 & 0 \tabularnewline
2 & -0.116247 & -2.5336 & 0.005806 \tabularnewline
3 & 0.09011 & 1.9639 & 0.025063 \tabularnewline
4 & -0.152634 & -3.3266 & 0.000474 \tabularnewline
5 & 0.051248 & 1.1169 & 0.132298 \tabularnewline
6 & -0.22773 & -4.9633 & 0 \tabularnewline
7 & -0.125648 & -2.7384 & 0.003203 \tabularnewline
8 & 0.017159 & 0.374 & 0.354293 \tabularnewline
9 & 0.045957 & 1.0016 & 0.158521 \tabularnewline
10 & -0.192958 & -4.2054 & 1.6e-05 \tabularnewline
11 & 0.109733 & 2.3916 & 0.008582 \tabularnewline
12 & 0.553555 & 12.0644 & 0 \tabularnewline
13 & -0.135928 & -2.9625 & 0.001602 \tabularnewline
14 & 0.065338 & 1.424 & 0.077549 \tabularnewline
15 & -0.035604 & -0.776 & 0.219077 \tabularnewline
16 & -0.15752 & -3.4331 & 0.000325 \tabularnewline
17 & 0.133997 & 2.9204 & 0.001831 \tabularnewline
18 & -0.331765 & -7.2306 & 0 \tabularnewline
19 & -0.047081 & -1.0261 & 0.15268 \tabularnewline
20 & 0.058668 & 1.2786 & 0.100823 \tabularnewline
21 & -0.080625 & -1.7572 & 0.039765 \tabularnewline
22 & -0.104025 & -2.2672 & 0.011914 \tabularnewline
23 & 0.126933 & 2.7664 & 0.002944 \tabularnewline
24 & 0.429748 & 9.3661 & 0 \tabularnewline
25 & -0.041158 & -0.897 & 0.18508 \tabularnewline
26 & 0.073776 & 1.6079 & 0.05426 \tabularnewline
27 & -0.116177 & -2.532 & 0.005831 \tabularnewline
28 & -0.062461 & -1.3613 & 0.087033 \tabularnewline
29 & 0.130641 & 2.8473 & 0.0023 \tabularnewline
30 & -0.433081 & -9.4388 & 0 \tabularnewline
31 & 0.032949 & 0.7181 & 0.236523 \tabularnewline
32 & 0.085049 & 1.8536 & 0.032209 \tabularnewline
33 & -0.19384 & -4.2247 & 1.4e-05 \tabularnewline
34 & 0.039494 & 0.8608 & 0.194902 \tabularnewline
35 & 0.063684 & 1.388 & 0.0829 \tabularnewline
36 & 0.344687 & 7.5123 & 0 \tabularnewline
37 & 0.138356 & 3.0154 & 0.001352 \tabularnewline
38 & -0.074757 & -1.6293 & 0.051958 \tabularnewline
39 & -0.127082 & -2.7697 & 0.002915 \tabularnewline
40 & 0.066022 & 1.4389 & 0.075415 \tabularnewline
41 & 0.020296 & 0.4423 & 0.329221 \tabularnewline
42 & -0.431767 & -9.4101 & 0 \tabularnewline
43 & 0.170472 & 3.7153 & 0.000114 \tabularnewline
44 & -0.078896 & -1.7195 & 0.043087 \tabularnewline
45 & -0.149368 & -3.2554 & 0.000607 \tabularnewline
46 & 0.151594 & 3.3039 & 0.000513 \tabularnewline
47 & -0.089546 & -1.9516 & 0.025786 \tabularnewline
48 & 0.427739 & 9.3224 & 0 \tabularnewline
\hline
\end{tabular}
%Source: https://freestatistics.org/blog/index.php?pk=75221&T=1

[TABLE]
[ROW][C]Autocorrelation Function[/C][/ROW]
[ROW][C]Time lag k[/C][C]ACF(k)[/C][C]T-STAT[/C][C]P-value[/C][/ROW]
[ROW][C]1[/C][C]-0.227653[/C][C]-4.9616[/C][C]0[/C][/ROW]
[ROW][C]2[/C][C]-0.116247[/C][C]-2.5336[/C][C]0.005806[/C][/ROW]
[ROW][C]3[/C][C]0.09011[/C][C]1.9639[/C][C]0.025063[/C][/ROW]
[ROW][C]4[/C][C]-0.152634[/C][C]-3.3266[/C][C]0.000474[/C][/ROW]
[ROW][C]5[/C][C]0.051248[/C][C]1.1169[/C][C]0.132298[/C][/ROW]
[ROW][C]6[/C][C]-0.22773[/C][C]-4.9633[/C][C]0[/C][/ROW]
[ROW][C]7[/C][C]-0.125648[/C][C]-2.7384[/C][C]0.003203[/C][/ROW]
[ROW][C]8[/C][C]0.017159[/C][C]0.374[/C][C]0.354293[/C][/ROW]
[ROW][C]9[/C][C]0.045957[/C][C]1.0016[/C][C]0.158521[/C][/ROW]
[ROW][C]10[/C][C]-0.192958[/C][C]-4.2054[/C][C]1.6e-05[/C][/ROW]
[ROW][C]11[/C][C]0.109733[/C][C]2.3916[/C][C]0.008582[/C][/ROW]
[ROW][C]12[/C][C]0.553555[/C][C]12.0644[/C][C]0[/C][/ROW]
[ROW][C]13[/C][C]-0.135928[/C][C]-2.9625[/C][C]0.001602[/C][/ROW]
[ROW][C]14[/C][C]0.065338[/C][C]1.424[/C][C]0.077549[/C][/ROW]
[ROW][C]15[/C][C]-0.035604[/C][C]-0.776[/C][C]0.219077[/C][/ROW]
[ROW][C]16[/C][C]-0.15752[/C][C]-3.4331[/C][C]0.000325[/C][/ROW]
[ROW][C]17[/C][C]0.133997[/C][C]2.9204[/C][C]0.001831[/C][/ROW]
[ROW][C]18[/C][C]-0.331765[/C][C]-7.2306[/C][C]0[/C][/ROW]
[ROW][C]19[/C][C]-0.047081[/C][C]-1.0261[/C][C]0.15268[/C][/ROW]
[ROW][C]20[/C][C]0.058668[/C][C]1.2786[/C][C]0.100823[/C][/ROW]
[ROW][C]21[/C][C]-0.080625[/C][C]-1.7572[/C][C]0.039765[/C][/ROW]
[ROW][C]22[/C][C]-0.104025[/C][C]-2.2672[/C][C]0.011914[/C][/ROW]
[ROW][C]23[/C][C]0.126933[/C][C]2.7664[/C][C]0.002944[/C][/ROW]
[ROW][C]24[/C][C]0.429748[/C][C]9.3661[/C][C]0[/C][/ROW]
[ROW][C]25[/C][C]-0.041158[/C][C]-0.897[/C][C]0.18508[/C][/ROW]
[ROW][C]26[/C][C]0.073776[/C][C]1.6079[/C][C]0.05426[/C][/ROW]
[ROW][C]27[/C][C]-0.116177[/C][C]-2.532[/C][C]0.005831[/C][/ROW]
[ROW][C]28[/C][C]-0.062461[/C][C]-1.3613[/C][C]0.087033[/C][/ROW]
[ROW][C]29[/C][C]0.130641[/C][C]2.8473[/C][C]0.0023[/C][/ROW]
[ROW][C]30[/C][C]-0.433081[/C][C]-9.4388[/C][C]0[/C][/ROW]
[ROW][C]31[/C][C]0.032949[/C][C]0.7181[/C][C]0.236523[/C][/ROW]
[ROW][C]32[/C][C]0.085049[/C][C]1.8536[/C][C]0.032209[/C][/ROW]
[ROW][C]33[/C][C]-0.19384[/C][C]-4.2247[/C][C]1.4e-05[/C][/ROW]
[ROW][C]34[/C][C]0.039494[/C][C]0.8608[/C][C]0.194902[/C][/ROW]
[ROW][C]35[/C][C]0.063684[/C][C]1.388[/C][C]0.0829[/C][/ROW]
[ROW][C]36[/C][C]0.344687[/C][C]7.5123[/C][C]0[/C][/ROW]
[ROW][C]37[/C][C]0.138356[/C][C]3.0154[/C][C]0.001352[/C][/ROW]
[ROW][C]38[/C][C]-0.074757[/C][C]-1.6293[/C][C]0.051958[/C][/ROW]
[ROW][C]39[/C][C]-0.127082[/C][C]-2.7697[/C][C]0.002915[/C][/ROW]
[ROW][C]40[/C][C]0.066022[/C][C]1.4389[/C][C]0.075415[/C][/ROW]
[ROW][C]41[/C][C]0.020296[/C][C]0.4423[/C][C]0.329221[/C][/ROW]
[ROW][C]42[/C][C]-0.431767[/C][C]-9.4101[/C][C]0[/C][/ROW]
[ROW][C]43[/C][C]0.170472[/C][C]3.7153[/C][C]0.000114[/C][/ROW]
[ROW][C]44[/C][C]-0.078896[/C][C]-1.7195[/C][C]0.043087[/C][/ROW]
[ROW][C]45[/C][C]-0.149368[/C][C]-3.2554[/C][C]0.000607[/C][/ROW]
[ROW][C]46[/C][C]0.151594[/C][C]3.3039[/C][C]0.000513[/C][/ROW]
[ROW][C]47[/C][C]-0.089546[/C][C]-1.9516[/C][C]0.025786[/C][/ROW]
[ROW][C]48[/C][C]0.427739[/C][C]9.3224[/C][C]0[/C][/ROW]
[/TABLE]
Source: https://freestatistics.org/blog/index.php?pk=75221&T=1

Globally Unique Identifier (entire table): ba.freestatistics.org/blog/index.php?pk=75221&T=1

As an alternative you can also use a QR Code:  

The GUIDs for individual cells are displayed in the table below:

Autocorrelation Function
Time lag kACF(k)T-STATP-value
1-0.227653-4.96160
2-0.116247-2.53360.005806
30.090111.96390.025063
4-0.152634-3.32660.000474
50.0512481.11690.132298
6-0.22773-4.96330
7-0.125648-2.73840.003203
80.0171590.3740.354293
90.0459571.00160.158521
10-0.192958-4.20541.6e-05
110.1097332.39160.008582
120.55355512.06440
13-0.135928-2.96250.001602
140.0653381.4240.077549
15-0.035604-0.7760.219077
16-0.15752-3.43310.000325
170.1339972.92040.001831
18-0.331765-7.23060
19-0.047081-1.02610.15268
200.0586681.27860.100823
21-0.080625-1.75720.039765
22-0.104025-2.26720.011914
230.1269332.76640.002944
240.4297489.36610
25-0.041158-0.8970.18508
260.0737761.60790.05426
27-0.116177-2.5320.005831
28-0.062461-1.36130.087033
290.1306412.84730.0023
30-0.433081-9.43880
310.0329490.71810.236523
320.0850491.85360.032209
33-0.19384-4.22471.4e-05
340.0394940.86080.194902
350.0636841.3880.0829
360.3446877.51230
370.1383563.01540.001352
38-0.074757-1.62930.051958
39-0.127082-2.76970.002915
400.0660221.43890.075415
410.0202960.44230.329221
42-0.431767-9.41010
430.1704723.71530.000114
44-0.078896-1.71950.043087
45-0.149368-3.25540.000607
460.1515943.30390.000513
47-0.089546-1.95160.025786
480.4277399.32240


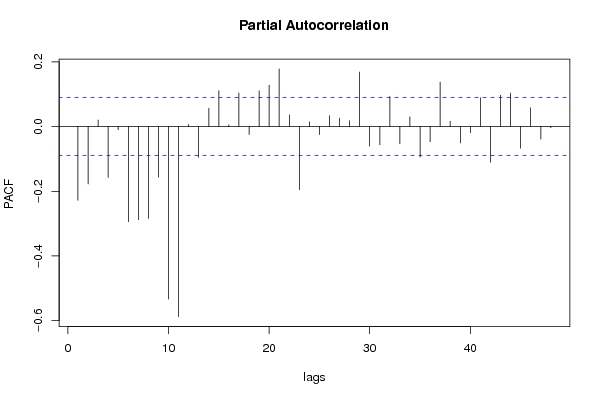
Partial Autocorrelation Function
Time lag kPACF(k)T-STATP-value
1-0.227653-4.96160
2-0.17726-3.86336.4e-05
30.0202540.44140.329556
4-0.157049-3.42280.000337
5-0.009981-0.21750.413947
6-0.294186-6.41160
7-0.288104-6.27910
8-0.283937-6.18830
9-0.156524-3.41140.000351
10-0.533336-11.62380
11-0.58767-12.8080
120.0061620.13430.446612
13-0.094895-2.06820.019581
140.057141.24530.106812
150.1106612.41180.008126
160.0053950.11760.453229
170.1038592.26360.012026
18-0.024045-0.5240.300246
190.1107462.41370.008085
200.1280832.79150.002729
210.1782913.88585.8e-05
220.0359860.78430.216627
23-0.195146-4.25311.3e-05
240.014890.32450.372846
25-0.024697-0.53830.295324
260.0339250.73940.230021
270.0261290.56950.284654
280.0184580.40230.343828
290.1685243.67290.000134
30-0.060232-1.31270.094953
31-0.056386-1.22890.109857
320.0927532.02150.021893
33-0.053211-1.15970.123373
340.0302070.65830.255317
35-0.094208-2.05320.0203
36-0.046617-1.0160.155072
370.1375252.99730.001433
380.016840.3670.356884
39-0.050609-1.1030.135292
40-0.01892-0.41240.340131
410.0893171.94660.026084
42-0.110194-2.40160.008353
430.0970522.11520.017467
440.1039252.2650.011982
45-0.066803-1.45590.073034
460.0582391.26930.102478
47-0.038531-0.83980.200733
48-0.003545-0.07730.469223

\begin{tabular}{lllllllll}
\hline
Partial Autocorrelation Function \tabularnewline
Time lag k & PACF(k) & T-STAT & P-value \tabularnewline
1 & -0.227653 & -4.9616 & 0 \tabularnewline
2 & -0.17726 & -3.8633 & 6.4e-05 \tabularnewline
3 & 0.020254 & 0.4414 & 0.329556 \tabularnewline
4 & -0.157049 & -3.4228 & 0.000337 \tabularnewline
5 & -0.009981 & -0.2175 & 0.413947 \tabularnewline
6 & -0.294186 & -6.4116 & 0 \tabularnewline
7 & -0.288104 & -6.2791 & 0 \tabularnewline
8 & -0.283937 & -6.1883 & 0 \tabularnewline
9 & -0.156524 & -3.4114 & 0.000351 \tabularnewline
10 & -0.533336 & -11.6238 & 0 \tabularnewline
11 & -0.58767 & -12.808 & 0 \tabularnewline
12 & 0.006162 & 0.1343 & 0.446612 \tabularnewline
13 & -0.094895 & -2.0682 & 0.019581 \tabularnewline
14 & 0.05714 & 1.2453 & 0.106812 \tabularnewline
15 & 0.110661 & 2.4118 & 0.008126 \tabularnewline
16 & 0.005395 & 0.1176 & 0.453229 \tabularnewline
17 & 0.103859 & 2.2636 & 0.012026 \tabularnewline
18 & -0.024045 & -0.524 & 0.300246 \tabularnewline
19 & 0.110746 & 2.4137 & 0.008085 \tabularnewline
20 & 0.128083 & 2.7915 & 0.002729 \tabularnewline
21 & 0.178291 & 3.8858 & 5.8e-05 \tabularnewline
22 & 0.035986 & 0.7843 & 0.216627 \tabularnewline
23 & -0.195146 & -4.2531 & 1.3e-05 \tabularnewline
24 & 0.01489 & 0.3245 & 0.372846 \tabularnewline
25 & -0.024697 & -0.5383 & 0.295324 \tabularnewline
26 & 0.033925 & 0.7394 & 0.230021 \tabularnewline
27 & 0.026129 & 0.5695 & 0.284654 \tabularnewline
28 & 0.018458 & 0.4023 & 0.343828 \tabularnewline
29 & 0.168524 & 3.6729 & 0.000134 \tabularnewline
30 & -0.060232 & -1.3127 & 0.094953 \tabularnewline
31 & -0.056386 & -1.2289 & 0.109857 \tabularnewline
32 & 0.092753 & 2.0215 & 0.021893 \tabularnewline
33 & -0.053211 & -1.1597 & 0.123373 \tabularnewline
34 & 0.030207 & 0.6583 & 0.255317 \tabularnewline
35 & -0.094208 & -2.0532 & 0.0203 \tabularnewline
36 & -0.046617 & -1.016 & 0.155072 \tabularnewline
37 & 0.137525 & 2.9973 & 0.001433 \tabularnewline
38 & 0.01684 & 0.367 & 0.356884 \tabularnewline
39 & -0.050609 & -1.103 & 0.135292 \tabularnewline
40 & -0.01892 & -0.4124 & 0.340131 \tabularnewline
41 & 0.089317 & 1.9466 & 0.026084 \tabularnewline
42 & -0.110194 & -2.4016 & 0.008353 \tabularnewline
43 & 0.097052 & 2.1152 & 0.017467 \tabularnewline
44 & 0.103925 & 2.265 & 0.011982 \tabularnewline
45 & -0.066803 & -1.4559 & 0.073034 \tabularnewline
46 & 0.058239 & 1.2693 & 0.102478 \tabularnewline
47 & -0.038531 & -0.8398 & 0.200733 \tabularnewline
48 & -0.003545 & -0.0773 & 0.469223 \tabularnewline
\hline
\end{tabular}
%Source: https://freestatistics.org/blog/index.php?pk=75221&T=2

[TABLE]
[ROW][C]Partial Autocorrelation Function[/C][/ROW]
[ROW][C]Time lag k[/C][C]PACF(k)[/C][C]T-STAT[/C][C]P-value[/C][/ROW]
[ROW][C]1[/C][C]-0.227653[/C][C]-4.9616[/C][C]0[/C][/ROW]
[ROW][C]2[/C][C]-0.17726[/C][C]-3.8633[/C][C]6.4e-05[/C][/ROW]
[ROW][C]3[/C][C]0.020254[/C][C]0.4414[/C][C]0.329556[/C][/ROW]
[ROW][C]4[/C][C]-0.157049[/C][C]-3.4228[/C][C]0.000337[/C][/ROW]
[ROW][C]5[/C][C]-0.009981[/C][C]-0.2175[/C][C]0.413947[/C][/ROW]
[ROW][C]6[/C][C]-0.294186[/C][C]-6.4116[/C][C]0[/C][/ROW]
[ROW][C]7[/C][C]-0.288104[/C][C]-6.2791[/C][C]0[/C][/ROW]
[ROW][C]8[/C][C]-0.283937[/C][C]-6.1883[/C][C]0[/C][/ROW]
[ROW][C]9[/C][C]-0.156524[/C][C]-3.4114[/C][C]0.000351[/C][/ROW]
[ROW][C]10[/C][C]-0.533336[/C][C]-11.6238[/C][C]0[/C][/ROW]
[ROW][C]11[/C][C]-0.58767[/C][C]-12.808[/C][C]0[/C][/ROW]
[ROW][C]12[/C][C]0.006162[/C][C]0.1343[/C][C]0.446612[/C][/ROW]
[ROW][C]13[/C][C]-0.094895[/C][C]-2.0682[/C][C]0.019581[/C][/ROW]
[ROW][C]14[/C][C]0.05714[/C][C]1.2453[/C][C]0.106812[/C][/ROW]
[ROW][C]15[/C][C]0.110661[/C][C]2.4118[/C][C]0.008126[/C][/ROW]
[ROW][C]16[/C][C]0.005395[/C][C]0.1176[/C][C]0.453229[/C][/ROW]
[ROW][C]17[/C][C]0.103859[/C][C]2.2636[/C][C]0.012026[/C][/ROW]
[ROW][C]18[/C][C]-0.024045[/C][C]-0.524[/C][C]0.300246[/C][/ROW]
[ROW][C]19[/C][C]0.110746[/C][C]2.4137[/C][C]0.008085[/C][/ROW]
[ROW][C]20[/C][C]0.128083[/C][C]2.7915[/C][C]0.002729[/C][/ROW]
[ROW][C]21[/C][C]0.178291[/C][C]3.8858[/C][C]5.8e-05[/C][/ROW]
[ROW][C]22[/C][C]0.035986[/C][C]0.7843[/C][C]0.216627[/C][/ROW]
[ROW][C]23[/C][C]-0.195146[/C][C]-4.2531[/C][C]1.3e-05[/C][/ROW]
[ROW][C]24[/C][C]0.01489[/C][C]0.3245[/C][C]0.372846[/C][/ROW]
[ROW][C]25[/C][C]-0.024697[/C][C]-0.5383[/C][C]0.295324[/C][/ROW]
[ROW][C]26[/C][C]0.033925[/C][C]0.7394[/C][C]0.230021[/C][/ROW]
[ROW][C]27[/C][C]0.026129[/C][C]0.5695[/C][C]0.284654[/C][/ROW]
[ROW][C]28[/C][C]0.018458[/C][C]0.4023[/C][C]0.343828[/C][/ROW]
[ROW][C]29[/C][C]0.168524[/C][C]3.6729[/C][C]0.000134[/C][/ROW]
[ROW][C]30[/C][C]-0.060232[/C][C]-1.3127[/C][C]0.094953[/C][/ROW]
[ROW][C]31[/C][C]-0.056386[/C][C]-1.2289[/C][C]0.109857[/C][/ROW]
[ROW][C]32[/C][C]0.092753[/C][C]2.0215[/C][C]0.021893[/C][/ROW]
[ROW][C]33[/C][C]-0.053211[/C][C]-1.1597[/C][C]0.123373[/C][/ROW]
[ROW][C]34[/C][C]0.030207[/C][C]0.6583[/C][C]0.255317[/C][/ROW]
[ROW][C]35[/C][C]-0.094208[/C][C]-2.0532[/C][C]0.0203[/C][/ROW]
[ROW][C]36[/C][C]-0.046617[/C][C]-1.016[/C][C]0.155072[/C][/ROW]
[ROW][C]37[/C][C]0.137525[/C][C]2.9973[/C][C]0.001433[/C][/ROW]
[ROW][C]38[/C][C]0.01684[/C][C]0.367[/C][C]0.356884[/C][/ROW]
[ROW][C]39[/C][C]-0.050609[/C][C]-1.103[/C][C]0.135292[/C][/ROW]
[ROW][C]40[/C][C]-0.01892[/C][C]-0.4124[/C][C]0.340131[/C][/ROW]
[ROW][C]41[/C][C]0.089317[/C][C]1.9466[/C][C]0.026084[/C][/ROW]
[ROW][C]42[/C][C]-0.110194[/C][C]-2.4016[/C][C]0.008353[/C][/ROW]
[ROW][C]43[/C][C]0.097052[/C][C]2.1152[/C][C]0.017467[/C][/ROW]
[ROW][C]44[/C][C]0.103925[/C][C]2.265[/C][C]0.011982[/C][/ROW]
[ROW][C]45[/C][C]-0.066803[/C][C]-1.4559[/C][C]0.073034[/C][/ROW]
[ROW][C]46[/C][C]0.058239[/C][C]1.2693[/C][C]0.102478[/C][/ROW]
[ROW][C]47[/C][C]-0.038531[/C][C]-0.8398[/C][C]0.200733[/C][/ROW]
[ROW][C]48[/C][C]-0.003545[/C][C]-0.0773[/C][C]0.469223[/C][/ROW]
[/TABLE]
Source: https://freestatistics.org/blog/index.php?pk=75221&T=2

Globally Unique Identifier (entire table): ba.freestatistics.org/blog/index.php?pk=75221&T=2

As an alternative you can also use a QR Code:  

The GUIDs for individual cells are displayed in the table below:

Partial Autocorrelation Function
Time lag kPACF(k)T-STATP-value
1-0.227653-4.96160
2-0.17726-3.86336.4e-05
30.0202540.44140.329556
4-0.157049-3.42280.000337
5-0.009981-0.21750.413947
6-0.294186-6.41160
7-0.288104-6.27910
8-0.283937-6.18830
9-0.156524-3.41140.000351
10-0.533336-11.62380
11-0.58767-12.8080
120.0061620.13430.446612
13-0.094895-2.06820.019581
140.057141.24530.106812
150.1106612.41180.008126
160.0053950.11760.453229
170.1038592.26360.012026
18-0.024045-0.5240.300246
190.1107462.41370.008085
200.1280832.79150.002729
210.1782913.88585.8e-05
220.0359860.78430.216627
23-0.195146-4.25311.3e-05
240.014890.32450.372846
25-0.024697-0.53830.295324
260.0339250.73940.230021
270.0261290.56950.284654
280.0184580.40230.343828
290.1685243.67290.000134
30-0.060232-1.31270.094953
31-0.056386-1.22890.109857
320.0927532.02150.021893
33-0.053211-1.15970.123373
340.0302070.65830.255317
35-0.094208-2.05320.0203
36-0.046617-1.0160.155072
370.1375252.99730.001433
380.016840.3670.356884
39-0.050609-1.1030.135292
40-0.01892-0.41240.340131
410.0893171.94660.026084
42-0.110194-2.40160.008353
430.0970522.11520.017467
440.1039252.2650.011982
45-0.066803-1.45590.073034
460.0582391.26930.102478
47-0.038531-0.83980.200733
48-0.003545-0.07730.469223


Parameters (Session):
par1 = 48 ; par2 = 1 ; par3 = 1 ; par4 = 0 ; par5 = 12 ; par6 = White Noise ; par7 = 0.95 ;
Parameters (R input):
par1 = 48 ; par2 = 1 ; par3 = 1 ; par4 = 0 ; par5 = 12 ; par6 = White Noise ; par7 = 0.95 ;
R code (references can be found in the software module):
if (par1 == 'Default') {
par1 = 10*log10(length(x))
} else {
par1 <- as.numeric(par1)
}
par2 <- as.numeric(par2)
par3 <- as.numeric(par3)
par4 <- as.numeric(par4)
par5 <- as.numeric(par5)
if (par6 == 'White Noise') par6 <- 'white' else par6 <- 'ma'
par7 <- as.numeric(par7)
if (par2 == 0) {
x <- log(x)
} else {
x <- (x ^ par2 - 1) / par2
}
if (par3 > 0) x <- diff(x,lag=1,difference=par3)
if (par4 > 0) x <- diff(x,lag=par5,difference=par4)
bitmap(file='pic1.png')
racf <- acf(x, par1, main='Autocorrelation', xlab='time lag', ylab='ACF', ci.type=par6, ci=par7, sub=paste('(lambda=',par2,', d=',par3,', D=',par4,', CI=', par7, ', CI type=',par6,')',sep=''))
dev.off()
bitmap(file='pic2.png')
rpacf <- pacf(x,par1,main='Partial Autocorrelation',xlab='lags',ylab='PACF')
dev.off()
(myacf <- c(racf$acf))
(mypacf <- c(rpacf$acf))
lengthx <- length(x)
sqrtn <- sqrt(lengthx)
load(file='createtable')
a<-table.start()
a<-table.row.start(a)
a<-table.element(a,'Autocorrelation Function',4,TRUE)
a<-table.row.end(a)
a<-table.row.start(a)
a<-table.element(a,'Time lag k',header=TRUE)
a<-table.element(a,hyperlink('basics.htm','ACF(k)','click here for more information about the Autocorrelation Function'),header=TRUE)
a<-table.element(a,'T-STAT',header=TRUE)
a<-table.element(a,'P-value',header=TRUE)
a<-table.row.end(a)
for (i in 2:(par1+1)) {
a<-table.row.start(a)
a<-table.element(a,i-1,header=TRUE)
a<-table.element(a,round(myacf[i],6))
mytstat <- myacf[i]*sqrtn
a<-table.element(a,round(mytstat,4))
a<-table.element(a,round(1-pt(abs(mytstat),lengthx),6))
a<-table.row.end(a)
}
a<-table.end(a)
table.save(a,file='mytable.tab')
a<-table.start()
a<-table.row.start(a)
a<-table.element(a,'Partial Autocorrelation Function',4,TRUE)
a<-table.row.end(a)
a<-table.row.start(a)
a<-table.element(a,'Time lag k',header=TRUE)
a<-table.element(a,hyperlink('basics.htm','PACF(k)','click here for more information about the Partial Autocorrelation Function'),header=TRUE)
a<-table.element(a,'T-STAT',header=TRUE)
a<-table.element(a,'P-value',header=TRUE)
a<-table.row.end(a)
for (i in 1:par1) {
a<-table.row.start(a)
a<-table.element(a,i,header=TRUE)
a<-table.element(a,round(mypacf[i],6))
mytstat <- mypacf[i]*sqrtn
a<-table.element(a,round(mytstat,4))
a<-table.element(a,round(1-pt(abs(mytstat),lengthx),6))
a<-table.row.end(a)
}
a<-table.end(a)
table.save(a,file='mytable1.tab')