Free Statistics

of Irreproducible Research!

Author's title

Author*Unverified author*
R Software Modulerwasp_autocorrelation.wasp
Title produced by software(Partial) Autocorrelation Function
Date of computationMon, 03 May 2010 15:22:50 +0000
Cite this page as followsStatistical Computations at FreeStatistics.org, Office for Research Development and Education, URL https://freestatistics.org/blog/index.php?v=date/2010/May/03/t1272900202r6aesg2pmwpofij.htm/, Retrieved Tue, 16 Apr 2024 10:17:02 +0000
Statistical Computations at FreeStatistics.org, Office for Research Development and Education, URL https://freestatistics.org/blog/index.php?pk=75229, Retrieved Tue, 16 Apr 2024 10:17:02 +0000
QR Codes:

Original text written by user:
IsPrivate?No (this computation is public)
User-defined keywordsKDGP2W21
Estimated Impact169
Family? (F = Feedback message, R = changed R code, M = changed R Module, P = changed Parameters, D = changed Data)
-     [(Partial) Autocorrelation Function] [Autocorrelatie - ...] [2010-05-03 15:17:23] [b4937ffbe9570f0099c263e57fe261b0]
-    D    [(Partial) Autocorrelation Function] [Autocorrelatie - ...] [2010-05-03 15:22:50] [f4f549f228d34384e7bf90c4c5a21d21] [Current]
Feedback Forum

Post a new message
Dataseries X:
112
118
129
99
116
168
118
129
205
147
150
267
126
129
124
97
102
127
222
214
118
141
154
226
89
77
82
97
127
121
117
117
106
112
134
169
75
108
115
85
101
108
109
124
105
95
135
164
88
85
112
87
91
87
87
142
95
108
139
159
61
82
124
93
108
75
87
103
90
108
123
129
57
65
67
71
76
67
110
118
99
85
107
141
58
65
70
86
93
74
87
73
101
100
96
157
63
115
70
66
67
83
79
77
102
116
100
135
71
60
89
74
73
91
86
74
87
87
109
137
43
69
73
77
69
76
78
70
83
65
110
132
54
55
66
65
60
65
96
55
71
63
74
106
34
47
56
53
53
55
67
52
46
51
58
91
33
40
46
45
41
55
57
54
46
52
48
77
30
35
42
48
44
45
46


Summary of computational transaction
Raw Inputview raw input (R code)
Raw Outputview raw output of R engine
Computing time1 seconds
R Server'Gwilym Jenkins' @ 72.249.127.135

\begin{tabular}{lllllllll}
\hline
Summary of computational transaction \tabularnewline
Raw Input & view raw input (R code)  \tabularnewline
Raw Output & view raw output of R engine  \tabularnewline
Computing time & 1 seconds \tabularnewline
R Server & 'Gwilym Jenkins' @ 72.249.127.135 \tabularnewline
\hline
\end{tabular}
%Source: https://freestatistics.org/blog/index.php?pk=75229&T=0

[TABLE]
[ROW][C]Summary of computational transaction[/C][/ROW]
[ROW][C]Raw Input[/C][C]view raw input (R code) [/C][/ROW]
[ROW][C]Raw Output[/C][C]view raw output of R engine [/C][/ROW]
[ROW][C]Computing time[/C][C]1 seconds[/C][/ROW]
[ROW][C]R Server[/C][C]'Gwilym Jenkins' @ 72.249.127.135[/C][/ROW]
[/TABLE]
Source: https://freestatistics.org/blog/index.php?pk=75229&T=0

Globally Unique Identifier (entire table): ba.freestatistics.org/blog/index.php?pk=75229&T=0

As an alternative you can also use a QR Code:  

The GUIDs for individual cells are displayed in the table below:

Summary of computational transaction
Raw Inputview raw input (R code)
Raw Outputview raw output of R engine
Computing time1 seconds
R Server'Gwilym Jenkins' @ 72.249.127.135


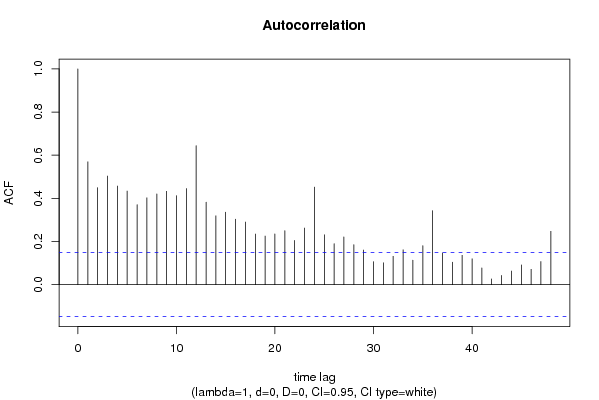
Autocorrelation Function
Time lag kACF(k)T-STATP-value
10.5697747.53740
20.4495775.94730
30.5034146.65950
40.457146.04740
50.4341815.74370
60.3711034.90921e-06
70.4024865.32440
80.4208695.56760
90.4331025.72940
100.4126025.45820
110.4456085.89480
120.6440348.51980
130.3822135.05621e-06
140.3190134.22012e-05
150.3362544.44828e-06
160.3036364.01674.4e-05
170.290293.84028.6e-05
180.2349043.10750.001101
190.22542.98180.001637
200.2353143.11290.001082
210.2502623.31070.000565
220.2050612.71270.00367
230.2627333.47560.000321
240.4522295.98240
250.2310393.05640.001296
260.1900652.51430.006414
270.2210872.92470.001952
280.1855262.45430.007548
290.1607032.12590.017457
300.1066221.41050.080088
310.1013131.34030.090951
320.1318081.74370.041487
330.1614222.13540.017059
340.1136351.50330.067288
350.1809582.39390.008865
360.3428124.5355e-06
370.1470291.9450.026688
380.1041711.3780.084974
390.1359541.79850.036911
400.1202081.59020.056796
410.0776431.02710.152892
420.0267190.35350.362085
430.0428280.56660.285868
440.063260.83690.201908
450.0914881.21030.113903
460.0710540.940.174269
470.1073621.42030.078655
480.2476313.27590.000635

\begin{tabular}{lllllllll}
\hline
Autocorrelation Function \tabularnewline
Time lag k & ACF(k) & T-STAT & P-value \tabularnewline
1 & 0.569774 & 7.5374 & 0 \tabularnewline
2 & 0.449577 & 5.9473 & 0 \tabularnewline
3 & 0.503414 & 6.6595 & 0 \tabularnewline
4 & 0.45714 & 6.0474 & 0 \tabularnewline
5 & 0.434181 & 5.7437 & 0 \tabularnewline
6 & 0.371103 & 4.9092 & 1e-06 \tabularnewline
7 & 0.402486 & 5.3244 & 0 \tabularnewline
8 & 0.420869 & 5.5676 & 0 \tabularnewline
9 & 0.433102 & 5.7294 & 0 \tabularnewline
10 & 0.412602 & 5.4582 & 0 \tabularnewline
11 & 0.445608 & 5.8948 & 0 \tabularnewline
12 & 0.644034 & 8.5198 & 0 \tabularnewline
13 & 0.382213 & 5.0562 & 1e-06 \tabularnewline
14 & 0.319013 & 4.2201 & 2e-05 \tabularnewline
15 & 0.336254 & 4.4482 & 8e-06 \tabularnewline
16 & 0.303636 & 4.0167 & 4.4e-05 \tabularnewline
17 & 0.29029 & 3.8402 & 8.6e-05 \tabularnewline
18 & 0.234904 & 3.1075 & 0.001101 \tabularnewline
19 & 0.2254 & 2.9818 & 0.001637 \tabularnewline
20 & 0.235314 & 3.1129 & 0.001082 \tabularnewline
21 & 0.250262 & 3.3107 & 0.000565 \tabularnewline
22 & 0.205061 & 2.7127 & 0.00367 \tabularnewline
23 & 0.262733 & 3.4756 & 0.000321 \tabularnewline
24 & 0.452229 & 5.9824 & 0 \tabularnewline
25 & 0.231039 & 3.0564 & 0.001296 \tabularnewline
26 & 0.190065 & 2.5143 & 0.006414 \tabularnewline
27 & 0.221087 & 2.9247 & 0.001952 \tabularnewline
28 & 0.185526 & 2.4543 & 0.007548 \tabularnewline
29 & 0.160703 & 2.1259 & 0.017457 \tabularnewline
30 & 0.106622 & 1.4105 & 0.080088 \tabularnewline
31 & 0.101313 & 1.3403 & 0.090951 \tabularnewline
32 & 0.131808 & 1.7437 & 0.041487 \tabularnewline
33 & 0.161422 & 2.1354 & 0.017059 \tabularnewline
34 & 0.113635 & 1.5033 & 0.067288 \tabularnewline
35 & 0.180958 & 2.3939 & 0.008865 \tabularnewline
36 & 0.342812 & 4.535 & 5e-06 \tabularnewline
37 & 0.147029 & 1.945 & 0.026688 \tabularnewline
38 & 0.104171 & 1.378 & 0.084974 \tabularnewline
39 & 0.135954 & 1.7985 & 0.036911 \tabularnewline
40 & 0.120208 & 1.5902 & 0.056796 \tabularnewline
41 & 0.077643 & 1.0271 & 0.152892 \tabularnewline
42 & 0.026719 & 0.3535 & 0.362085 \tabularnewline
43 & 0.042828 & 0.5666 & 0.285868 \tabularnewline
44 & 0.06326 & 0.8369 & 0.201908 \tabularnewline
45 & 0.091488 & 1.2103 & 0.113903 \tabularnewline
46 & 0.071054 & 0.94 & 0.174269 \tabularnewline
47 & 0.107362 & 1.4203 & 0.078655 \tabularnewline
48 & 0.247631 & 3.2759 & 0.000635 \tabularnewline
\hline
\end{tabular}
%Source: https://freestatistics.org/blog/index.php?pk=75229&T=1

[TABLE]
[ROW][C]Autocorrelation Function[/C][/ROW]
[ROW][C]Time lag k[/C][C]ACF(k)[/C][C]T-STAT[/C][C]P-value[/C][/ROW]
[ROW][C]1[/C][C]0.569774[/C][C]7.5374[/C][C]0[/C][/ROW]
[ROW][C]2[/C][C]0.449577[/C][C]5.9473[/C][C]0[/C][/ROW]
[ROW][C]3[/C][C]0.503414[/C][C]6.6595[/C][C]0[/C][/ROW]
[ROW][C]4[/C][C]0.45714[/C][C]6.0474[/C][C]0[/C][/ROW]
[ROW][C]5[/C][C]0.434181[/C][C]5.7437[/C][C]0[/C][/ROW]
[ROW][C]6[/C][C]0.371103[/C][C]4.9092[/C][C]1e-06[/C][/ROW]
[ROW][C]7[/C][C]0.402486[/C][C]5.3244[/C][C]0[/C][/ROW]
[ROW][C]8[/C][C]0.420869[/C][C]5.5676[/C][C]0[/C][/ROW]
[ROW][C]9[/C][C]0.433102[/C][C]5.7294[/C][C]0[/C][/ROW]
[ROW][C]10[/C][C]0.412602[/C][C]5.4582[/C][C]0[/C][/ROW]
[ROW][C]11[/C][C]0.445608[/C][C]5.8948[/C][C]0[/C][/ROW]
[ROW][C]12[/C][C]0.644034[/C][C]8.5198[/C][C]0[/C][/ROW]
[ROW][C]13[/C][C]0.382213[/C][C]5.0562[/C][C]1e-06[/C][/ROW]
[ROW][C]14[/C][C]0.319013[/C][C]4.2201[/C][C]2e-05[/C][/ROW]
[ROW][C]15[/C][C]0.336254[/C][C]4.4482[/C][C]8e-06[/C][/ROW]
[ROW][C]16[/C][C]0.303636[/C][C]4.0167[/C][C]4.4e-05[/C][/ROW]
[ROW][C]17[/C][C]0.29029[/C][C]3.8402[/C][C]8.6e-05[/C][/ROW]
[ROW][C]18[/C][C]0.234904[/C][C]3.1075[/C][C]0.001101[/C][/ROW]
[ROW][C]19[/C][C]0.2254[/C][C]2.9818[/C][C]0.001637[/C][/ROW]
[ROW][C]20[/C][C]0.235314[/C][C]3.1129[/C][C]0.001082[/C][/ROW]
[ROW][C]21[/C][C]0.250262[/C][C]3.3107[/C][C]0.000565[/C][/ROW]
[ROW][C]22[/C][C]0.205061[/C][C]2.7127[/C][C]0.00367[/C][/ROW]
[ROW][C]23[/C][C]0.262733[/C][C]3.4756[/C][C]0.000321[/C][/ROW]
[ROW][C]24[/C][C]0.452229[/C][C]5.9824[/C][C]0[/C][/ROW]
[ROW][C]25[/C][C]0.231039[/C][C]3.0564[/C][C]0.001296[/C][/ROW]
[ROW][C]26[/C][C]0.190065[/C][C]2.5143[/C][C]0.006414[/C][/ROW]
[ROW][C]27[/C][C]0.221087[/C][C]2.9247[/C][C]0.001952[/C][/ROW]
[ROW][C]28[/C][C]0.185526[/C][C]2.4543[/C][C]0.007548[/C][/ROW]
[ROW][C]29[/C][C]0.160703[/C][C]2.1259[/C][C]0.017457[/C][/ROW]
[ROW][C]30[/C][C]0.106622[/C][C]1.4105[/C][C]0.080088[/C][/ROW]
[ROW][C]31[/C][C]0.101313[/C][C]1.3403[/C][C]0.090951[/C][/ROW]
[ROW][C]32[/C][C]0.131808[/C][C]1.7437[/C][C]0.041487[/C][/ROW]
[ROW][C]33[/C][C]0.161422[/C][C]2.1354[/C][C]0.017059[/C][/ROW]
[ROW][C]34[/C][C]0.113635[/C][C]1.5033[/C][C]0.067288[/C][/ROW]
[ROW][C]35[/C][C]0.180958[/C][C]2.3939[/C][C]0.008865[/C][/ROW]
[ROW][C]36[/C][C]0.342812[/C][C]4.535[/C][C]5e-06[/C][/ROW]
[ROW][C]37[/C][C]0.147029[/C][C]1.945[/C][C]0.026688[/C][/ROW]
[ROW][C]38[/C][C]0.104171[/C][C]1.378[/C][C]0.084974[/C][/ROW]
[ROW][C]39[/C][C]0.135954[/C][C]1.7985[/C][C]0.036911[/C][/ROW]
[ROW][C]40[/C][C]0.120208[/C][C]1.5902[/C][C]0.056796[/C][/ROW]
[ROW][C]41[/C][C]0.077643[/C][C]1.0271[/C][C]0.152892[/C][/ROW]
[ROW][C]42[/C][C]0.026719[/C][C]0.3535[/C][C]0.362085[/C][/ROW]
[ROW][C]43[/C][C]0.042828[/C][C]0.5666[/C][C]0.285868[/C][/ROW]
[ROW][C]44[/C][C]0.06326[/C][C]0.8369[/C][C]0.201908[/C][/ROW]
[ROW][C]45[/C][C]0.091488[/C][C]1.2103[/C][C]0.113903[/C][/ROW]
[ROW][C]46[/C][C]0.071054[/C][C]0.94[/C][C]0.174269[/C][/ROW]
[ROW][C]47[/C][C]0.107362[/C][C]1.4203[/C][C]0.078655[/C][/ROW]
[ROW][C]48[/C][C]0.247631[/C][C]3.2759[/C][C]0.000635[/C][/ROW]
[/TABLE]
Source: https://freestatistics.org/blog/index.php?pk=75229&T=1

Globally Unique Identifier (entire table): ba.freestatistics.org/blog/index.php?pk=75229&T=1

As an alternative you can also use a QR Code:  

The GUIDs for individual cells are displayed in the table below:

Autocorrelation Function
Time lag kACF(k)T-STATP-value
10.5697747.53740
20.4495775.94730
30.5034146.65950
40.457146.04740
50.4341815.74370
60.3711034.90921e-06
70.4024865.32440
80.4208695.56760
90.4331025.72940
100.4126025.45820
110.4456085.89480
120.6440348.51980
130.3822135.05621e-06
140.3190134.22012e-05
150.3362544.44828e-06
160.3036364.01674.4e-05
170.290293.84028.6e-05
180.2349043.10750.001101
190.22542.98180.001637
200.2353143.11290.001082
210.2502623.31070.000565
220.2050612.71270.00367
230.2627333.47560.000321
240.4522295.98240
250.2310393.05640.001296
260.1900652.51430.006414
270.2210872.92470.001952
280.1855262.45430.007548
290.1607032.12590.017457
300.1066221.41050.080088
310.1013131.34030.090951
320.1318081.74370.041487
330.1614222.13540.017059
340.1136351.50330.067288
350.1809582.39390.008865
360.3428124.5355e-06
370.1470291.9450.026688
380.1041711.3780.084974
390.1359541.79850.036911
400.1202081.59020.056796
410.0776431.02710.152892
420.0267190.35350.362085
430.0428280.56660.285868
440.063260.83690.201908
450.0914881.21030.113903
460.0710540.940.174269
470.1073621.42030.078655
480.2476313.27590.000635


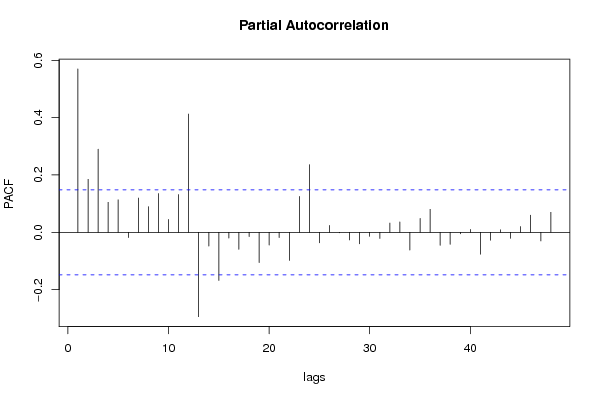
Partial Autocorrelation Function
Time lag kPACF(k)T-STATP-value
10.5697747.53740
20.184992.44720.007693
30.2901373.83828.6e-05
40.1045971.38370.084107
50.1132851.49860.067887
6-0.018401-0.24340.403983
70.1196691.58310.057606
80.089621.18560.118703
90.1353561.79060.037544
100.0449660.59490.276356
110.1316741.74190.041643
120.4122685.45380
13-0.294085-3.89047.1e-05
14-0.047773-0.6320.264114
15-0.16802-2.22270.013759
16-0.019871-0.26290.396481
17-0.059459-0.78660.2163
18-0.014617-0.19340.42345
19-0.105433-1.39470.08243
20-0.044634-0.59050.277823
21-0.018081-0.23920.405617
22-0.098117-1.2980.098003
230.1253461.65820.049537
240.2358243.11970.001059
25-0.036781-0.48660.313585
260.0240970.31880.375139
27-0.001902-0.02520.489975
28-0.0265-0.35060.363168
29-0.040154-0.53120.297981
30-0.014039-0.18570.426441
31-0.021334-0.28220.389055
320.0322330.42640.33517
330.036420.48180.31528
34-0.061704-0.81630.20773
350.0484140.64050.261357
360.0802521.06160.144932
37-0.04526-0.59870.275064
38-0.04191-0.55440.290002
39-0.005078-0.06720.47326
400.0098780.13070.448091
41-0.07616-1.00750.157542
42-0.027574-0.36480.357861
430.0089820.11880.452777
44-0.020689-0.27370.392323
450.0201910.26710.394851
460.0599270.79280.214495
47-0.029915-0.39570.346388
480.0699640.92550.17798

\begin{tabular}{lllllllll}
\hline
Partial Autocorrelation Function \tabularnewline
Time lag k & PACF(k) & T-STAT & P-value \tabularnewline
1 & 0.569774 & 7.5374 & 0 \tabularnewline
2 & 0.18499 & 2.4472 & 0.007693 \tabularnewline
3 & 0.290137 & 3.8382 & 8.6e-05 \tabularnewline
4 & 0.104597 & 1.3837 & 0.084107 \tabularnewline
5 & 0.113285 & 1.4986 & 0.067887 \tabularnewline
6 & -0.018401 & -0.2434 & 0.403983 \tabularnewline
7 & 0.119669 & 1.5831 & 0.057606 \tabularnewline
8 & 0.08962 & 1.1856 & 0.118703 \tabularnewline
9 & 0.135356 & 1.7906 & 0.037544 \tabularnewline
10 & 0.044966 & 0.5949 & 0.276356 \tabularnewline
11 & 0.131674 & 1.7419 & 0.041643 \tabularnewline
12 & 0.412268 & 5.4538 & 0 \tabularnewline
13 & -0.294085 & -3.8904 & 7.1e-05 \tabularnewline
14 & -0.047773 & -0.632 & 0.264114 \tabularnewline
15 & -0.16802 & -2.2227 & 0.013759 \tabularnewline
16 & -0.019871 & -0.2629 & 0.396481 \tabularnewline
17 & -0.059459 & -0.7866 & 0.2163 \tabularnewline
18 & -0.014617 & -0.1934 & 0.42345 \tabularnewline
19 & -0.105433 & -1.3947 & 0.08243 \tabularnewline
20 & -0.044634 & -0.5905 & 0.277823 \tabularnewline
21 & -0.018081 & -0.2392 & 0.405617 \tabularnewline
22 & -0.098117 & -1.298 & 0.098003 \tabularnewline
23 & 0.125346 & 1.6582 & 0.049537 \tabularnewline
24 & 0.235824 & 3.1197 & 0.001059 \tabularnewline
25 & -0.036781 & -0.4866 & 0.313585 \tabularnewline
26 & 0.024097 & 0.3188 & 0.375139 \tabularnewline
27 & -0.001902 & -0.0252 & 0.489975 \tabularnewline
28 & -0.0265 & -0.3506 & 0.363168 \tabularnewline
29 & -0.040154 & -0.5312 & 0.297981 \tabularnewline
30 & -0.014039 & -0.1857 & 0.426441 \tabularnewline
31 & -0.021334 & -0.2822 & 0.389055 \tabularnewline
32 & 0.032233 & 0.4264 & 0.33517 \tabularnewline
33 & 0.03642 & 0.4818 & 0.31528 \tabularnewline
34 & -0.061704 & -0.8163 & 0.20773 \tabularnewline
35 & 0.048414 & 0.6405 & 0.261357 \tabularnewline
36 & 0.080252 & 1.0616 & 0.144932 \tabularnewline
37 & -0.04526 & -0.5987 & 0.275064 \tabularnewline
38 & -0.04191 & -0.5544 & 0.290002 \tabularnewline
39 & -0.005078 & -0.0672 & 0.47326 \tabularnewline
40 & 0.009878 & 0.1307 & 0.448091 \tabularnewline
41 & -0.07616 & -1.0075 & 0.157542 \tabularnewline
42 & -0.027574 & -0.3648 & 0.357861 \tabularnewline
43 & 0.008982 & 0.1188 & 0.452777 \tabularnewline
44 & -0.020689 & -0.2737 & 0.392323 \tabularnewline
45 & 0.020191 & 0.2671 & 0.394851 \tabularnewline
46 & 0.059927 & 0.7928 & 0.214495 \tabularnewline
47 & -0.029915 & -0.3957 & 0.346388 \tabularnewline
48 & 0.069964 & 0.9255 & 0.17798 \tabularnewline
\hline
\end{tabular}
%Source: https://freestatistics.org/blog/index.php?pk=75229&T=2

[TABLE]
[ROW][C]Partial Autocorrelation Function[/C][/ROW]
[ROW][C]Time lag k[/C][C]PACF(k)[/C][C]T-STAT[/C][C]P-value[/C][/ROW]
[ROW][C]1[/C][C]0.569774[/C][C]7.5374[/C][C]0[/C][/ROW]
[ROW][C]2[/C][C]0.18499[/C][C]2.4472[/C][C]0.007693[/C][/ROW]
[ROW][C]3[/C][C]0.290137[/C][C]3.8382[/C][C]8.6e-05[/C][/ROW]
[ROW][C]4[/C][C]0.104597[/C][C]1.3837[/C][C]0.084107[/C][/ROW]
[ROW][C]5[/C][C]0.113285[/C][C]1.4986[/C][C]0.067887[/C][/ROW]
[ROW][C]6[/C][C]-0.018401[/C][C]-0.2434[/C][C]0.403983[/C][/ROW]
[ROW][C]7[/C][C]0.119669[/C][C]1.5831[/C][C]0.057606[/C][/ROW]
[ROW][C]8[/C][C]0.08962[/C][C]1.1856[/C][C]0.118703[/C][/ROW]
[ROW][C]9[/C][C]0.135356[/C][C]1.7906[/C][C]0.037544[/C][/ROW]
[ROW][C]10[/C][C]0.044966[/C][C]0.5949[/C][C]0.276356[/C][/ROW]
[ROW][C]11[/C][C]0.131674[/C][C]1.7419[/C][C]0.041643[/C][/ROW]
[ROW][C]12[/C][C]0.412268[/C][C]5.4538[/C][C]0[/C][/ROW]
[ROW][C]13[/C][C]-0.294085[/C][C]-3.8904[/C][C]7.1e-05[/C][/ROW]
[ROW][C]14[/C][C]-0.047773[/C][C]-0.632[/C][C]0.264114[/C][/ROW]
[ROW][C]15[/C][C]-0.16802[/C][C]-2.2227[/C][C]0.013759[/C][/ROW]
[ROW][C]16[/C][C]-0.019871[/C][C]-0.2629[/C][C]0.396481[/C][/ROW]
[ROW][C]17[/C][C]-0.059459[/C][C]-0.7866[/C][C]0.2163[/C][/ROW]
[ROW][C]18[/C][C]-0.014617[/C][C]-0.1934[/C][C]0.42345[/C][/ROW]
[ROW][C]19[/C][C]-0.105433[/C][C]-1.3947[/C][C]0.08243[/C][/ROW]
[ROW][C]20[/C][C]-0.044634[/C][C]-0.5905[/C][C]0.277823[/C][/ROW]
[ROW][C]21[/C][C]-0.018081[/C][C]-0.2392[/C][C]0.405617[/C][/ROW]
[ROW][C]22[/C][C]-0.098117[/C][C]-1.298[/C][C]0.098003[/C][/ROW]
[ROW][C]23[/C][C]0.125346[/C][C]1.6582[/C][C]0.049537[/C][/ROW]
[ROW][C]24[/C][C]0.235824[/C][C]3.1197[/C][C]0.001059[/C][/ROW]
[ROW][C]25[/C][C]-0.036781[/C][C]-0.4866[/C][C]0.313585[/C][/ROW]
[ROW][C]26[/C][C]0.024097[/C][C]0.3188[/C][C]0.375139[/C][/ROW]
[ROW][C]27[/C][C]-0.001902[/C][C]-0.0252[/C][C]0.489975[/C][/ROW]
[ROW][C]28[/C][C]-0.0265[/C][C]-0.3506[/C][C]0.363168[/C][/ROW]
[ROW][C]29[/C][C]-0.040154[/C][C]-0.5312[/C][C]0.297981[/C][/ROW]
[ROW][C]30[/C][C]-0.014039[/C][C]-0.1857[/C][C]0.426441[/C][/ROW]
[ROW][C]31[/C][C]-0.021334[/C][C]-0.2822[/C][C]0.389055[/C][/ROW]
[ROW][C]32[/C][C]0.032233[/C][C]0.4264[/C][C]0.33517[/C][/ROW]
[ROW][C]33[/C][C]0.03642[/C][C]0.4818[/C][C]0.31528[/C][/ROW]
[ROW][C]34[/C][C]-0.061704[/C][C]-0.8163[/C][C]0.20773[/C][/ROW]
[ROW][C]35[/C][C]0.048414[/C][C]0.6405[/C][C]0.261357[/C][/ROW]
[ROW][C]36[/C][C]0.080252[/C][C]1.0616[/C][C]0.144932[/C][/ROW]
[ROW][C]37[/C][C]-0.04526[/C][C]-0.5987[/C][C]0.275064[/C][/ROW]
[ROW][C]38[/C][C]-0.04191[/C][C]-0.5544[/C][C]0.290002[/C][/ROW]
[ROW][C]39[/C][C]-0.005078[/C][C]-0.0672[/C][C]0.47326[/C][/ROW]
[ROW][C]40[/C][C]0.009878[/C][C]0.1307[/C][C]0.448091[/C][/ROW]
[ROW][C]41[/C][C]-0.07616[/C][C]-1.0075[/C][C]0.157542[/C][/ROW]
[ROW][C]42[/C][C]-0.027574[/C][C]-0.3648[/C][C]0.357861[/C][/ROW]
[ROW][C]43[/C][C]0.008982[/C][C]0.1188[/C][C]0.452777[/C][/ROW]
[ROW][C]44[/C][C]-0.020689[/C][C]-0.2737[/C][C]0.392323[/C][/ROW]
[ROW][C]45[/C][C]0.020191[/C][C]0.2671[/C][C]0.394851[/C][/ROW]
[ROW][C]46[/C][C]0.059927[/C][C]0.7928[/C][C]0.214495[/C][/ROW]
[ROW][C]47[/C][C]-0.029915[/C][C]-0.3957[/C][C]0.346388[/C][/ROW]
[ROW][C]48[/C][C]0.069964[/C][C]0.9255[/C][C]0.17798[/C][/ROW]
[/TABLE]
Source: https://freestatistics.org/blog/index.php?pk=75229&T=2

Globally Unique Identifier (entire table): ba.freestatistics.org/blog/index.php?pk=75229&T=2

As an alternative you can also use a QR Code:  

The GUIDs for individual cells are displayed in the table below:

Partial Autocorrelation Function
Time lag kPACF(k)T-STATP-value
10.5697747.53740
20.184992.44720.007693
30.2901373.83828.6e-05
40.1045971.38370.084107
50.1132851.49860.067887
6-0.018401-0.24340.403983
70.1196691.58310.057606
80.089621.18560.118703
90.1353561.79060.037544
100.0449660.59490.276356
110.1316741.74190.041643
120.4122685.45380
13-0.294085-3.89047.1e-05
14-0.047773-0.6320.264114
15-0.16802-2.22270.013759
16-0.019871-0.26290.396481
17-0.059459-0.78660.2163
18-0.014617-0.19340.42345
19-0.105433-1.39470.08243
20-0.044634-0.59050.277823
21-0.018081-0.23920.405617
22-0.098117-1.2980.098003
230.1253461.65820.049537
240.2358243.11970.001059
25-0.036781-0.48660.313585
260.0240970.31880.375139
27-0.001902-0.02520.489975
28-0.0265-0.35060.363168
29-0.040154-0.53120.297981
30-0.014039-0.18570.426441
31-0.021334-0.28220.389055
320.0322330.42640.33517
330.036420.48180.31528
34-0.061704-0.81630.20773
350.0484140.64050.261357
360.0802521.06160.144932
37-0.04526-0.59870.275064
38-0.04191-0.55440.290002
39-0.005078-0.06720.47326
400.0098780.13070.448091
41-0.07616-1.00750.157542
42-0.027574-0.36480.357861
430.0089820.11880.452777
44-0.020689-0.27370.392323
450.0201910.26710.394851
460.0599270.79280.214495
47-0.029915-0.39570.346388
480.0699640.92550.17798


Parameters (Session):
par1 = 48 ; par2 = 1 ; par3 = 0 ; par4 = 0 ; par5 = 12 ; par6 = White Noise ; par7 = 0.95 ;
Parameters (R input):
par1 = 48 ; par2 = 1 ; par3 = 0 ; par4 = 0 ; par5 = 12 ; par6 = White Noise ; par7 = 0.95 ;
R code (references can be found in the software module):
if (par1 == 'Default') {
par1 = 10*log10(length(x))
} else {
par1 <- as.numeric(par1)
}
par2 <- as.numeric(par2)
par3 <- as.numeric(par3)
par4 <- as.numeric(par4)
par5 <- as.numeric(par5)
if (par6 == 'White Noise') par6 <- 'white' else par6 <- 'ma'
par7 <- as.numeric(par7)
if (par2 == 0) {
x <- log(x)
} else {
x <- (x ^ par2 - 1) / par2
}
if (par3 > 0) x <- diff(x,lag=1,difference=par3)
if (par4 > 0) x <- diff(x,lag=par5,difference=par4)
bitmap(file='pic1.png')
racf <- acf(x, par1, main='Autocorrelation', xlab='time lag', ylab='ACF', ci.type=par6, ci=par7, sub=paste('(lambda=',par2,', d=',par3,', D=',par4,', CI=', par7, ', CI type=',par6,')',sep=''))
dev.off()
bitmap(file='pic2.png')
rpacf <- pacf(x,par1,main='Partial Autocorrelation',xlab='lags',ylab='PACF')
dev.off()
(myacf <- c(racf$acf))
(mypacf <- c(rpacf$acf))
lengthx <- length(x)
sqrtn <- sqrt(lengthx)
load(file='createtable')
a<-table.start()
a<-table.row.start(a)
a<-table.element(a,'Autocorrelation Function',4,TRUE)
a<-table.row.end(a)
a<-table.row.start(a)
a<-table.element(a,'Time lag k',header=TRUE)
a<-table.element(a,hyperlink('basics.htm','ACF(k)','click here for more information about the Autocorrelation Function'),header=TRUE)
a<-table.element(a,'T-STAT',header=TRUE)
a<-table.element(a,'P-value',header=TRUE)
a<-table.row.end(a)
for (i in 2:(par1+1)) {
a<-table.row.start(a)
a<-table.element(a,i-1,header=TRUE)
a<-table.element(a,round(myacf[i],6))
mytstat <- myacf[i]*sqrtn
a<-table.element(a,round(mytstat,4))
a<-table.element(a,round(1-pt(abs(mytstat),lengthx),6))
a<-table.row.end(a)
}
a<-table.end(a)
table.save(a,file='mytable.tab')
a<-table.start()
a<-table.row.start(a)
a<-table.element(a,'Partial Autocorrelation Function',4,TRUE)
a<-table.row.end(a)
a<-table.row.start(a)
a<-table.element(a,'Time lag k',header=TRUE)
a<-table.element(a,hyperlink('basics.htm','PACF(k)','click here for more information about the Partial Autocorrelation Function'),header=TRUE)
a<-table.element(a,'T-STAT',header=TRUE)
a<-table.element(a,'P-value',header=TRUE)
a<-table.row.end(a)
for (i in 1:par1) {
a<-table.row.start(a)
a<-table.element(a,i,header=TRUE)
a<-table.element(a,round(mypacf[i],6))
mytstat <- mypacf[i]*sqrtn
a<-table.element(a,round(mytstat,4))
a<-table.element(a,round(1-pt(abs(mytstat),lengthx),6))
a<-table.row.end(a)
}
a<-table.end(a)
table.save(a,file='mytable1.tab')