Free Statistics

of Irreproducible Research!

Author's title

Author*Unverified author*
R Software Modulerwasp_autocorrelation.wasp
Title produced by software(Partial) Autocorrelation Function
Date of computationMon, 03 May 2010 16:13:15 +0000
Cite this page as followsStatistical Computations at FreeStatistics.org, Office for Research Development and Education, URL https://freestatistics.org/blog/index.php?v=date/2010/May/03/t1272903252mlfnyu8bzu11aul.htm/, Retrieved Thu, 18 Apr 2024 20:06:15 +0000
Statistical Computations at FreeStatistics.org, Office for Research Development and Education, URL https://freestatistics.org/blog/index.php?pk=75246, Retrieved Thu, 18 Apr 2024 20:06:15 +0000
QR Codes:

Original text written by user:
IsPrivate?No (this computation is public)
User-defined keywordsKDGP2W21
Estimated Impact113
Family? (F = Feedback message, R = changed R code, M = changed R Module, P = changed Parameters, D = changed Data)
-       [(Partial) Autocorrelation Function] [Melino Olivini - ...] [2010-05-03 16:13:15] [2156736b6f7843cba1ea73b621b47743] [Current]
Feedback Forum

Post a new message
Dataseries X:
5221.3
5115.9
5107.4
5202.1
5307.5
5266.1
5329.8
5263.4
5177.1
5204.9
5185.2
5189.8
5253.8
5372.3
5478.4
5590.5
5699.8
5797.9
5854.3
5902.4
5956.9
6007.8
6101.7
6148.6
6207.4
6232
6291.7
6323.4
6365
6435
6493.4
6606.8
6639.1
6723.5
6759.4
6848.6
6918.1
6963.5
7013.1
7030.9
7112.1
7130.3
7130.8
7076.9
7040.8
7086.5
7120.7
7154.1
7228.2
7297.9
7369.5
7450.7
7459.7
7497.5
7536
7637.4
7715.1
7815.7
7859.5
7951.6
7973.7
7988
8053.1
8112
8169.2
8303.1
8372.7
8470.6
8536.1
8665.8
8773.7
8838.4
8936.2
8995.3
9098.9
9237.1
9315.5
9392.6
9502.2
9671.1
9695.6
9847.9
9836.6
9887.7
9875.6
9905.9
9871.1
9910
9977.3
10031.6
10090.7
10095.8
10126
10212.7
10398.7
10467
10543.6
10634.2
10728.7
10796.4
10875.8
10946.1
11050
11086.1
11217.3
11291.7
11314.1
11356.4
11357.8
11491.4
11625.7
11620.7


Summary of computational transaction
Raw Inputview raw input (R code)
Raw Outputview raw output of R engine
Computing time1 seconds
R Server'RServer@AstonUniversity' @ vre.aston.ac.uk

\begin{tabular}{lllllllll}
\hline
Summary of computational transaction \tabularnewline
Raw Input & view raw input (R code)  \tabularnewline
Raw Output & view raw output of R engine  \tabularnewline
Computing time & 1 seconds \tabularnewline
R Server & 'RServer@AstonUniversity' @ vre.aston.ac.uk \tabularnewline
\hline
\end{tabular}
%Source: https://freestatistics.org/blog/index.php?pk=75246&T=0

[TABLE]
[ROW][C]Summary of computational transaction[/C][/ROW]
[ROW][C]Raw Input[/C][C]view raw input (R code) [/C][/ROW]
[ROW][C]Raw Output[/C][C]view raw output of R engine [/C][/ROW]
[ROW][C]Computing time[/C][C]1 seconds[/C][/ROW]
[ROW][C]R Server[/C][C]'RServer@AstonUniversity' @ vre.aston.ac.uk[/C][/ROW]
[/TABLE]
Source: https://freestatistics.org/blog/index.php?pk=75246&T=0

Globally Unique Identifier (entire table): ba.freestatistics.org/blog/index.php?pk=75246&T=0

As an alternative you can also use a QR Code:  

The GUIDs for individual cells are displayed in the table below:

Summary of computational transaction
Raw Inputview raw input (R code)
Raw Outputview raw output of R engine
Computing time1 seconds
R Server'RServer@AstonUniversity' @ vre.aston.ac.uk


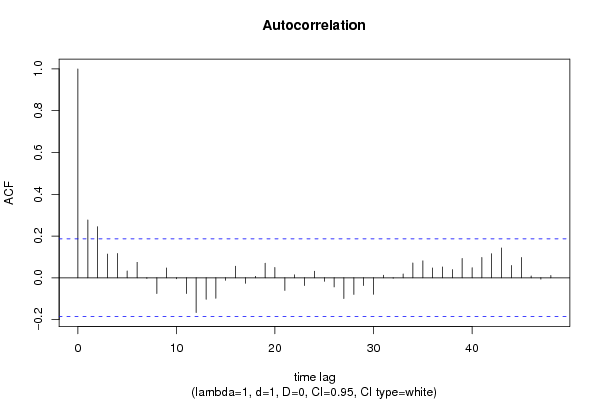
Autocorrelation Function
Time lag kACF(k)T-STATP-value
10.2765412.91350.002161
20.2448762.57990.005594
30.113591.19670.116979
40.1161351.22360.111855
50.0329780.34740.364456
60.0739240.77880.218865
7-0.002949-0.03110.487633
8-0.075433-0.79470.214233
90.0471710.4970.310096
10-0.004736-0.04990.480147
11-0.075488-0.79530.214064
12-0.165988-1.74880.041545
13-0.103074-1.0860.139927
14-0.097961-1.03210.152137
15-0.012155-0.12810.449166
160.0551120.58060.281329
17-0.026104-0.2750.391907
180.0070550.07430.47044
190.0699340.73680.2314
200.0491860.51820.302672
21-0.060222-0.63450.263538
220.014270.15030.440383
23-0.036754-0.38720.349664
240.0317710.33470.369229
25-0.01668-0.17570.43041
26-0.043546-0.45880.323641
27-0.09882-1.04110.150039
28-0.07941-0.83660.202297
29-0.036708-0.38670.349843
30-0.078973-0.8320.203589
310.0119150.12550.450165
32-0.002279-0.0240.490442
330.0181080.19080.424524
340.0712150.75030.227332
350.0812160.85570.197014
360.0471320.49660.310239
370.051420.54170.294539
380.0391420.41240.340427
390.0921040.97040.166984
400.0486040.51210.304808
410.0970421.02240.154406
420.1156361.21830.112846
430.1430881.50750.067259
440.0588560.62010.268237
450.0970081.0220.15449
460.0084240.08880.464718
47-0.006559-0.06910.472517
480.0114580.12070.452065

\begin{tabular}{lllllllll}
\hline
Autocorrelation Function \tabularnewline
Time lag k & ACF(k) & T-STAT & P-value \tabularnewline
1 & 0.276541 & 2.9135 & 0.002161 \tabularnewline
2 & 0.244876 & 2.5799 & 0.005594 \tabularnewline
3 & 0.11359 & 1.1967 & 0.116979 \tabularnewline
4 & 0.116135 & 1.2236 & 0.111855 \tabularnewline
5 & 0.032978 & 0.3474 & 0.364456 \tabularnewline
6 & 0.073924 & 0.7788 & 0.218865 \tabularnewline
7 & -0.002949 & -0.0311 & 0.487633 \tabularnewline
8 & -0.075433 & -0.7947 & 0.214233 \tabularnewline
9 & 0.047171 & 0.497 & 0.310096 \tabularnewline
10 & -0.004736 & -0.0499 & 0.480147 \tabularnewline
11 & -0.075488 & -0.7953 & 0.214064 \tabularnewline
12 & -0.165988 & -1.7488 & 0.041545 \tabularnewline
13 & -0.103074 & -1.086 & 0.139927 \tabularnewline
14 & -0.097961 & -1.0321 & 0.152137 \tabularnewline
15 & -0.012155 & -0.1281 & 0.449166 \tabularnewline
16 & 0.055112 & 0.5806 & 0.281329 \tabularnewline
17 & -0.026104 & -0.275 & 0.391907 \tabularnewline
18 & 0.007055 & 0.0743 & 0.47044 \tabularnewline
19 & 0.069934 & 0.7368 & 0.2314 \tabularnewline
20 & 0.049186 & 0.5182 & 0.302672 \tabularnewline
21 & -0.060222 & -0.6345 & 0.263538 \tabularnewline
22 & 0.01427 & 0.1503 & 0.440383 \tabularnewline
23 & -0.036754 & -0.3872 & 0.349664 \tabularnewline
24 & 0.031771 & 0.3347 & 0.369229 \tabularnewline
25 & -0.01668 & -0.1757 & 0.43041 \tabularnewline
26 & -0.043546 & -0.4588 & 0.323641 \tabularnewline
27 & -0.09882 & -1.0411 & 0.150039 \tabularnewline
28 & -0.07941 & -0.8366 & 0.202297 \tabularnewline
29 & -0.036708 & -0.3867 & 0.349843 \tabularnewline
30 & -0.078973 & -0.832 & 0.203589 \tabularnewline
31 & 0.011915 & 0.1255 & 0.450165 \tabularnewline
32 & -0.002279 & -0.024 & 0.490442 \tabularnewline
33 & 0.018108 & 0.1908 & 0.424524 \tabularnewline
34 & 0.071215 & 0.7503 & 0.227332 \tabularnewline
35 & 0.081216 & 0.8557 & 0.197014 \tabularnewline
36 & 0.047132 & 0.4966 & 0.310239 \tabularnewline
37 & 0.05142 & 0.5417 & 0.294539 \tabularnewline
38 & 0.039142 & 0.4124 & 0.340427 \tabularnewline
39 & 0.092104 & 0.9704 & 0.166984 \tabularnewline
40 & 0.048604 & 0.5121 & 0.304808 \tabularnewline
41 & 0.097042 & 1.0224 & 0.154406 \tabularnewline
42 & 0.115636 & 1.2183 & 0.112846 \tabularnewline
43 & 0.143088 & 1.5075 & 0.067259 \tabularnewline
44 & 0.058856 & 0.6201 & 0.268237 \tabularnewline
45 & 0.097008 & 1.022 & 0.15449 \tabularnewline
46 & 0.008424 & 0.0888 & 0.464718 \tabularnewline
47 & -0.006559 & -0.0691 & 0.472517 \tabularnewline
48 & 0.011458 & 0.1207 & 0.452065 \tabularnewline
\hline
\end{tabular}
%Source: https://freestatistics.org/blog/index.php?pk=75246&T=1

[TABLE]
[ROW][C]Autocorrelation Function[/C][/ROW]
[ROW][C]Time lag k[/C][C]ACF(k)[/C][C]T-STAT[/C][C]P-value[/C][/ROW]
[ROW][C]1[/C][C]0.276541[/C][C]2.9135[/C][C]0.002161[/C][/ROW]
[ROW][C]2[/C][C]0.244876[/C][C]2.5799[/C][C]0.005594[/C][/ROW]
[ROW][C]3[/C][C]0.11359[/C][C]1.1967[/C][C]0.116979[/C][/ROW]
[ROW][C]4[/C][C]0.116135[/C][C]1.2236[/C][C]0.111855[/C][/ROW]
[ROW][C]5[/C][C]0.032978[/C][C]0.3474[/C][C]0.364456[/C][/ROW]
[ROW][C]6[/C][C]0.073924[/C][C]0.7788[/C][C]0.218865[/C][/ROW]
[ROW][C]7[/C][C]-0.002949[/C][C]-0.0311[/C][C]0.487633[/C][/ROW]
[ROW][C]8[/C][C]-0.075433[/C][C]-0.7947[/C][C]0.214233[/C][/ROW]
[ROW][C]9[/C][C]0.047171[/C][C]0.497[/C][C]0.310096[/C][/ROW]
[ROW][C]10[/C][C]-0.004736[/C][C]-0.0499[/C][C]0.480147[/C][/ROW]
[ROW][C]11[/C][C]-0.075488[/C][C]-0.7953[/C][C]0.214064[/C][/ROW]
[ROW][C]12[/C][C]-0.165988[/C][C]-1.7488[/C][C]0.041545[/C][/ROW]
[ROW][C]13[/C][C]-0.103074[/C][C]-1.086[/C][C]0.139927[/C][/ROW]
[ROW][C]14[/C][C]-0.097961[/C][C]-1.0321[/C][C]0.152137[/C][/ROW]
[ROW][C]15[/C][C]-0.012155[/C][C]-0.1281[/C][C]0.449166[/C][/ROW]
[ROW][C]16[/C][C]0.055112[/C][C]0.5806[/C][C]0.281329[/C][/ROW]
[ROW][C]17[/C][C]-0.026104[/C][C]-0.275[/C][C]0.391907[/C][/ROW]
[ROW][C]18[/C][C]0.007055[/C][C]0.0743[/C][C]0.47044[/C][/ROW]
[ROW][C]19[/C][C]0.069934[/C][C]0.7368[/C][C]0.2314[/C][/ROW]
[ROW][C]20[/C][C]0.049186[/C][C]0.5182[/C][C]0.302672[/C][/ROW]
[ROW][C]21[/C][C]-0.060222[/C][C]-0.6345[/C][C]0.263538[/C][/ROW]
[ROW][C]22[/C][C]0.01427[/C][C]0.1503[/C][C]0.440383[/C][/ROW]
[ROW][C]23[/C][C]-0.036754[/C][C]-0.3872[/C][C]0.349664[/C][/ROW]
[ROW][C]24[/C][C]0.031771[/C][C]0.3347[/C][C]0.369229[/C][/ROW]
[ROW][C]25[/C][C]-0.01668[/C][C]-0.1757[/C][C]0.43041[/C][/ROW]
[ROW][C]26[/C][C]-0.043546[/C][C]-0.4588[/C][C]0.323641[/C][/ROW]
[ROW][C]27[/C][C]-0.09882[/C][C]-1.0411[/C][C]0.150039[/C][/ROW]
[ROW][C]28[/C][C]-0.07941[/C][C]-0.8366[/C][C]0.202297[/C][/ROW]
[ROW][C]29[/C][C]-0.036708[/C][C]-0.3867[/C][C]0.349843[/C][/ROW]
[ROW][C]30[/C][C]-0.078973[/C][C]-0.832[/C][C]0.203589[/C][/ROW]
[ROW][C]31[/C][C]0.011915[/C][C]0.1255[/C][C]0.450165[/C][/ROW]
[ROW][C]32[/C][C]-0.002279[/C][C]-0.024[/C][C]0.490442[/C][/ROW]
[ROW][C]33[/C][C]0.018108[/C][C]0.1908[/C][C]0.424524[/C][/ROW]
[ROW][C]34[/C][C]0.071215[/C][C]0.7503[/C][C]0.227332[/C][/ROW]
[ROW][C]35[/C][C]0.081216[/C][C]0.8557[/C][C]0.197014[/C][/ROW]
[ROW][C]36[/C][C]0.047132[/C][C]0.4966[/C][C]0.310239[/C][/ROW]
[ROW][C]37[/C][C]0.05142[/C][C]0.5417[/C][C]0.294539[/C][/ROW]
[ROW][C]38[/C][C]0.039142[/C][C]0.4124[/C][C]0.340427[/C][/ROW]
[ROW][C]39[/C][C]0.092104[/C][C]0.9704[/C][C]0.166984[/C][/ROW]
[ROW][C]40[/C][C]0.048604[/C][C]0.5121[/C][C]0.304808[/C][/ROW]
[ROW][C]41[/C][C]0.097042[/C][C]1.0224[/C][C]0.154406[/C][/ROW]
[ROW][C]42[/C][C]0.115636[/C][C]1.2183[/C][C]0.112846[/C][/ROW]
[ROW][C]43[/C][C]0.143088[/C][C]1.5075[/C][C]0.067259[/C][/ROW]
[ROW][C]44[/C][C]0.058856[/C][C]0.6201[/C][C]0.268237[/C][/ROW]
[ROW][C]45[/C][C]0.097008[/C][C]1.022[/C][C]0.15449[/C][/ROW]
[ROW][C]46[/C][C]0.008424[/C][C]0.0888[/C][C]0.464718[/C][/ROW]
[ROW][C]47[/C][C]-0.006559[/C][C]-0.0691[/C][C]0.472517[/C][/ROW]
[ROW][C]48[/C][C]0.011458[/C][C]0.1207[/C][C]0.452065[/C][/ROW]
[/TABLE]
Source: https://freestatistics.org/blog/index.php?pk=75246&T=1

Globally Unique Identifier (entire table): ba.freestatistics.org/blog/index.php?pk=75246&T=1

As an alternative you can also use a QR Code:  

The GUIDs for individual cells are displayed in the table below:

Autocorrelation Function
Time lag kACF(k)T-STATP-value
10.2765412.91350.002161
20.2448762.57990.005594
30.113591.19670.116979
40.1161351.22360.111855
50.0329780.34740.364456
60.0739240.77880.218865
7-0.002949-0.03110.487633
8-0.075433-0.79470.214233
90.0471710.4970.310096
10-0.004736-0.04990.480147
11-0.075488-0.79530.214064
12-0.165988-1.74880.041545
13-0.103074-1.0860.139927
14-0.097961-1.03210.152137
15-0.012155-0.12810.449166
160.0551120.58060.281329
17-0.026104-0.2750.391907
180.0070550.07430.47044
190.0699340.73680.2314
200.0491860.51820.302672
21-0.060222-0.63450.263538
220.014270.15030.440383
23-0.036754-0.38720.349664
240.0317710.33470.369229
25-0.01668-0.17570.43041
26-0.043546-0.45880.323641
27-0.09882-1.04110.150039
28-0.07941-0.83660.202297
29-0.036708-0.38670.349843
30-0.078973-0.8320.203589
310.0119150.12550.450165
32-0.002279-0.0240.490442
330.0181080.19080.424524
340.0712150.75030.227332
350.0812160.85570.197014
360.0471320.49660.310239
370.051420.54170.294539
380.0391420.41240.340427
390.0921040.97040.166984
400.0486040.51210.304808
410.0970421.02240.154406
420.1156361.21830.112846
430.1430881.50750.067259
440.0588560.62010.268237
450.0970081.0220.15449
460.0084240.08880.464718
47-0.006559-0.06910.472517
480.0114580.12070.452065


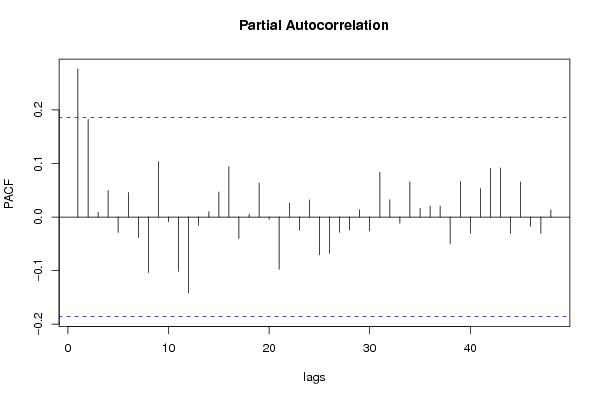
Partial Autocorrelation Function
Time lag kPACF(k)T-STATP-value
10.2765412.91350.002161
20.1823461.92110.02864
30.0087290.0920.463447
40.0493410.51980.302106
5-0.028738-0.30280.381314
60.0455990.48040.315937
7-0.038373-0.40430.343391
8-0.103581-1.09130.138754
90.103331.08870.139333
10-0.008935-0.09410.462586
11-0.101178-1.0660.144374
12-0.141658-1.49250.069207
13-0.015489-0.16320.435336
140.0099870.10520.458194
150.0469020.49410.311092
160.0938520.98880.162458
17-0.040168-0.42320.336485
180.0051460.05420.478431
190.0637470.67160.251611
20-0.004239-0.04470.482231
21-0.097641-1.02870.152926
220.0257290.27110.39342
23-0.024663-0.25980.397736
240.0317650.33470.369254
25-0.070526-0.7430.229516
26-0.067781-0.71410.238328
27-0.028625-0.30160.381769
28-0.024413-0.25720.398748
290.0135060.14230.443552
30-0.025727-0.27110.393427
310.0836230.8810.190103
320.0321660.33890.367665
33-0.011545-0.12160.451704
340.0656640.69180.245251
350.0166150.1750.430681
360.0208060.21920.413447
370.0204080.2150.415076
38-0.049453-0.5210.301697
390.0664770.70040.242577
40-0.030124-0.31740.375776
410.0530850.55930.288546
420.0912730.96160.169165
430.0915540.96460.168425
44-0.03054-0.32180.374121
450.0654690.68980.245894
46-0.017256-0.18180.428036
47-0.030373-0.320.374786
480.0132880.140.444459

\begin{tabular}{lllllllll}
\hline
Partial Autocorrelation Function \tabularnewline
Time lag k & PACF(k) & T-STAT & P-value \tabularnewline
1 & 0.276541 & 2.9135 & 0.002161 \tabularnewline
2 & 0.182346 & 1.9211 & 0.02864 \tabularnewline
3 & 0.008729 & 0.092 & 0.463447 \tabularnewline
4 & 0.049341 & 0.5198 & 0.302106 \tabularnewline
5 & -0.028738 & -0.3028 & 0.381314 \tabularnewline
6 & 0.045599 & 0.4804 & 0.315937 \tabularnewline
7 & -0.038373 & -0.4043 & 0.343391 \tabularnewline
8 & -0.103581 & -1.0913 & 0.138754 \tabularnewline
9 & 0.10333 & 1.0887 & 0.139333 \tabularnewline
10 & -0.008935 & -0.0941 & 0.462586 \tabularnewline
11 & -0.101178 & -1.066 & 0.144374 \tabularnewline
12 & -0.141658 & -1.4925 & 0.069207 \tabularnewline
13 & -0.015489 & -0.1632 & 0.435336 \tabularnewline
14 & 0.009987 & 0.1052 & 0.458194 \tabularnewline
15 & 0.046902 & 0.4941 & 0.311092 \tabularnewline
16 & 0.093852 & 0.9888 & 0.162458 \tabularnewline
17 & -0.040168 & -0.4232 & 0.336485 \tabularnewline
18 & 0.005146 & 0.0542 & 0.478431 \tabularnewline
19 & 0.063747 & 0.6716 & 0.251611 \tabularnewline
20 & -0.004239 & -0.0447 & 0.482231 \tabularnewline
21 & -0.097641 & -1.0287 & 0.152926 \tabularnewline
22 & 0.025729 & 0.2711 & 0.39342 \tabularnewline
23 & -0.024663 & -0.2598 & 0.397736 \tabularnewline
24 & 0.031765 & 0.3347 & 0.369254 \tabularnewline
25 & -0.070526 & -0.743 & 0.229516 \tabularnewline
26 & -0.067781 & -0.7141 & 0.238328 \tabularnewline
27 & -0.028625 & -0.3016 & 0.381769 \tabularnewline
28 & -0.024413 & -0.2572 & 0.398748 \tabularnewline
29 & 0.013506 & 0.1423 & 0.443552 \tabularnewline
30 & -0.025727 & -0.2711 & 0.393427 \tabularnewline
31 & 0.083623 & 0.881 & 0.190103 \tabularnewline
32 & 0.032166 & 0.3389 & 0.367665 \tabularnewline
33 & -0.011545 & -0.1216 & 0.451704 \tabularnewline
34 & 0.065664 & 0.6918 & 0.245251 \tabularnewline
35 & 0.016615 & 0.175 & 0.430681 \tabularnewline
36 & 0.020806 & 0.2192 & 0.413447 \tabularnewline
37 & 0.020408 & 0.215 & 0.415076 \tabularnewline
38 & -0.049453 & -0.521 & 0.301697 \tabularnewline
39 & 0.066477 & 0.7004 & 0.242577 \tabularnewline
40 & -0.030124 & -0.3174 & 0.375776 \tabularnewline
41 & 0.053085 & 0.5593 & 0.288546 \tabularnewline
42 & 0.091273 & 0.9616 & 0.169165 \tabularnewline
43 & 0.091554 & 0.9646 & 0.168425 \tabularnewline
44 & -0.03054 & -0.3218 & 0.374121 \tabularnewline
45 & 0.065469 & 0.6898 & 0.245894 \tabularnewline
46 & -0.017256 & -0.1818 & 0.428036 \tabularnewline
47 & -0.030373 & -0.32 & 0.374786 \tabularnewline
48 & 0.013288 & 0.14 & 0.444459 \tabularnewline
\hline
\end{tabular}
%Source: https://freestatistics.org/blog/index.php?pk=75246&T=2

[TABLE]
[ROW][C]Partial Autocorrelation Function[/C][/ROW]
[ROW][C]Time lag k[/C][C]PACF(k)[/C][C]T-STAT[/C][C]P-value[/C][/ROW]
[ROW][C]1[/C][C]0.276541[/C][C]2.9135[/C][C]0.002161[/C][/ROW]
[ROW][C]2[/C][C]0.182346[/C][C]1.9211[/C][C]0.02864[/C][/ROW]
[ROW][C]3[/C][C]0.008729[/C][C]0.092[/C][C]0.463447[/C][/ROW]
[ROW][C]4[/C][C]0.049341[/C][C]0.5198[/C][C]0.302106[/C][/ROW]
[ROW][C]5[/C][C]-0.028738[/C][C]-0.3028[/C][C]0.381314[/C][/ROW]
[ROW][C]6[/C][C]0.045599[/C][C]0.4804[/C][C]0.315937[/C][/ROW]
[ROW][C]7[/C][C]-0.038373[/C][C]-0.4043[/C][C]0.343391[/C][/ROW]
[ROW][C]8[/C][C]-0.103581[/C][C]-1.0913[/C][C]0.138754[/C][/ROW]
[ROW][C]9[/C][C]0.10333[/C][C]1.0887[/C][C]0.139333[/C][/ROW]
[ROW][C]10[/C][C]-0.008935[/C][C]-0.0941[/C][C]0.462586[/C][/ROW]
[ROW][C]11[/C][C]-0.101178[/C][C]-1.066[/C][C]0.144374[/C][/ROW]
[ROW][C]12[/C][C]-0.141658[/C][C]-1.4925[/C][C]0.069207[/C][/ROW]
[ROW][C]13[/C][C]-0.015489[/C][C]-0.1632[/C][C]0.435336[/C][/ROW]
[ROW][C]14[/C][C]0.009987[/C][C]0.1052[/C][C]0.458194[/C][/ROW]
[ROW][C]15[/C][C]0.046902[/C][C]0.4941[/C][C]0.311092[/C][/ROW]
[ROW][C]16[/C][C]0.093852[/C][C]0.9888[/C][C]0.162458[/C][/ROW]
[ROW][C]17[/C][C]-0.040168[/C][C]-0.4232[/C][C]0.336485[/C][/ROW]
[ROW][C]18[/C][C]0.005146[/C][C]0.0542[/C][C]0.478431[/C][/ROW]
[ROW][C]19[/C][C]0.063747[/C][C]0.6716[/C][C]0.251611[/C][/ROW]
[ROW][C]20[/C][C]-0.004239[/C][C]-0.0447[/C][C]0.482231[/C][/ROW]
[ROW][C]21[/C][C]-0.097641[/C][C]-1.0287[/C][C]0.152926[/C][/ROW]
[ROW][C]22[/C][C]0.025729[/C][C]0.2711[/C][C]0.39342[/C][/ROW]
[ROW][C]23[/C][C]-0.024663[/C][C]-0.2598[/C][C]0.397736[/C][/ROW]
[ROW][C]24[/C][C]0.031765[/C][C]0.3347[/C][C]0.369254[/C][/ROW]
[ROW][C]25[/C][C]-0.070526[/C][C]-0.743[/C][C]0.229516[/C][/ROW]
[ROW][C]26[/C][C]-0.067781[/C][C]-0.7141[/C][C]0.238328[/C][/ROW]
[ROW][C]27[/C][C]-0.028625[/C][C]-0.3016[/C][C]0.381769[/C][/ROW]
[ROW][C]28[/C][C]-0.024413[/C][C]-0.2572[/C][C]0.398748[/C][/ROW]
[ROW][C]29[/C][C]0.013506[/C][C]0.1423[/C][C]0.443552[/C][/ROW]
[ROW][C]30[/C][C]-0.025727[/C][C]-0.2711[/C][C]0.393427[/C][/ROW]
[ROW][C]31[/C][C]0.083623[/C][C]0.881[/C][C]0.190103[/C][/ROW]
[ROW][C]32[/C][C]0.032166[/C][C]0.3389[/C][C]0.367665[/C][/ROW]
[ROW][C]33[/C][C]-0.011545[/C][C]-0.1216[/C][C]0.451704[/C][/ROW]
[ROW][C]34[/C][C]0.065664[/C][C]0.6918[/C][C]0.245251[/C][/ROW]
[ROW][C]35[/C][C]0.016615[/C][C]0.175[/C][C]0.430681[/C][/ROW]
[ROW][C]36[/C][C]0.020806[/C][C]0.2192[/C][C]0.413447[/C][/ROW]
[ROW][C]37[/C][C]0.020408[/C][C]0.215[/C][C]0.415076[/C][/ROW]
[ROW][C]38[/C][C]-0.049453[/C][C]-0.521[/C][C]0.301697[/C][/ROW]
[ROW][C]39[/C][C]0.066477[/C][C]0.7004[/C][C]0.242577[/C][/ROW]
[ROW][C]40[/C][C]-0.030124[/C][C]-0.3174[/C][C]0.375776[/C][/ROW]
[ROW][C]41[/C][C]0.053085[/C][C]0.5593[/C][C]0.288546[/C][/ROW]
[ROW][C]42[/C][C]0.091273[/C][C]0.9616[/C][C]0.169165[/C][/ROW]
[ROW][C]43[/C][C]0.091554[/C][C]0.9646[/C][C]0.168425[/C][/ROW]
[ROW][C]44[/C][C]-0.03054[/C][C]-0.3218[/C][C]0.374121[/C][/ROW]
[ROW][C]45[/C][C]0.065469[/C][C]0.6898[/C][C]0.245894[/C][/ROW]
[ROW][C]46[/C][C]-0.017256[/C][C]-0.1818[/C][C]0.428036[/C][/ROW]
[ROW][C]47[/C][C]-0.030373[/C][C]-0.32[/C][C]0.374786[/C][/ROW]
[ROW][C]48[/C][C]0.013288[/C][C]0.14[/C][C]0.444459[/C][/ROW]
[/TABLE]
Source: https://freestatistics.org/blog/index.php?pk=75246&T=2

Globally Unique Identifier (entire table): ba.freestatistics.org/blog/index.php?pk=75246&T=2

As an alternative you can also use a QR Code:  

The GUIDs for individual cells are displayed in the table below:

Partial Autocorrelation Function
Time lag kPACF(k)T-STATP-value
10.2765412.91350.002161
20.1823461.92110.02864
30.0087290.0920.463447
40.0493410.51980.302106
5-0.028738-0.30280.381314
60.0455990.48040.315937
7-0.038373-0.40430.343391
8-0.103581-1.09130.138754
90.103331.08870.139333
10-0.008935-0.09410.462586
11-0.101178-1.0660.144374
12-0.141658-1.49250.069207
13-0.015489-0.16320.435336
140.0099870.10520.458194
150.0469020.49410.311092
160.0938520.98880.162458
17-0.040168-0.42320.336485
180.0051460.05420.478431
190.0637470.67160.251611
20-0.004239-0.04470.482231
21-0.097641-1.02870.152926
220.0257290.27110.39342
23-0.024663-0.25980.397736
240.0317650.33470.369254
25-0.070526-0.7430.229516
26-0.067781-0.71410.238328
27-0.028625-0.30160.381769
28-0.024413-0.25720.398748
290.0135060.14230.443552
30-0.025727-0.27110.393427
310.0836230.8810.190103
320.0321660.33890.367665
33-0.011545-0.12160.451704
340.0656640.69180.245251
350.0166150.1750.430681
360.0208060.21920.413447
370.0204080.2150.415076
38-0.049453-0.5210.301697
390.0664770.70040.242577
40-0.030124-0.31740.375776
410.0530850.55930.288546
420.0912730.96160.169165
430.0915540.96460.168425
44-0.03054-0.32180.374121
450.0654690.68980.245894
46-0.017256-0.18180.428036
47-0.030373-0.320.374786
480.0132880.140.444459


Parameters (Session):
par1 = 48 ; par2 = 1 ; par3 = 1 ; par4 = 0 ; par5 = 12 ; par6 = White Noise ; par7 = 0.95 ;
Parameters (R input):
par1 = 48 ; par2 = 1 ; par3 = 1 ; par4 = 0 ; par5 = 12 ; par6 = White Noise ; par7 = 0.95 ;
R code (references can be found in the software module):
if (par1 == 'Default') {
par1 = 10*log10(length(x))
} else {
par1 <- as.numeric(par1)
}
par2 <- as.numeric(par2)
par3 <- as.numeric(par3)
par4 <- as.numeric(par4)
par5 <- as.numeric(par5)
if (par6 == 'White Noise') par6 <- 'white' else par6 <- 'ma'
par7 <- as.numeric(par7)
if (par2 == 0) {
x <- log(x)
} else {
x <- (x ^ par2 - 1) / par2
}
if (par3 > 0) x <- diff(x,lag=1,difference=par3)
if (par4 > 0) x <- diff(x,lag=par5,difference=par4)
bitmap(file='pic1.png')
racf <- acf(x, par1, main='Autocorrelation', xlab='time lag', ylab='ACF', ci.type=par6, ci=par7, sub=paste('(lambda=',par2,', d=',par3,', D=',par4,', CI=', par7, ', CI type=',par6,')',sep=''))
dev.off()
bitmap(file='pic2.png')
rpacf <- pacf(x,par1,main='Partial Autocorrelation',xlab='lags',ylab='PACF')
dev.off()
(myacf <- c(racf$acf))
(mypacf <- c(rpacf$acf))
lengthx <- length(x)
sqrtn <- sqrt(lengthx)
load(file='createtable')
a<-table.start()
a<-table.row.start(a)
a<-table.element(a,'Autocorrelation Function',4,TRUE)
a<-table.row.end(a)
a<-table.row.start(a)
a<-table.element(a,'Time lag k',header=TRUE)
a<-table.element(a,hyperlink('basics.htm','ACF(k)','click here for more information about the Autocorrelation Function'),header=TRUE)
a<-table.element(a,'T-STAT',header=TRUE)
a<-table.element(a,'P-value',header=TRUE)
a<-table.row.end(a)
for (i in 2:(par1+1)) {
a<-table.row.start(a)
a<-table.element(a,i-1,header=TRUE)
a<-table.element(a,round(myacf[i],6))
mytstat <- myacf[i]*sqrtn
a<-table.element(a,round(mytstat,4))
a<-table.element(a,round(1-pt(abs(mytstat),lengthx),6))
a<-table.row.end(a)
}
a<-table.end(a)
table.save(a,file='mytable.tab')
a<-table.start()
a<-table.row.start(a)
a<-table.element(a,'Partial Autocorrelation Function',4,TRUE)
a<-table.row.end(a)
a<-table.row.start(a)
a<-table.element(a,'Time lag k',header=TRUE)
a<-table.element(a,hyperlink('basics.htm','PACF(k)','click here for more information about the Partial Autocorrelation Function'),header=TRUE)
a<-table.element(a,'T-STAT',header=TRUE)
a<-table.element(a,'P-value',header=TRUE)
a<-table.row.end(a)
for (i in 1:par1) {
a<-table.row.start(a)
a<-table.element(a,i,header=TRUE)
a<-table.element(a,round(mypacf[i],6))
mytstat <- mypacf[i]*sqrtn
a<-table.element(a,round(mytstat,4))
a<-table.element(a,round(1-pt(abs(mytstat),lengthx),6))
a<-table.row.end(a)
}
a<-table.end(a)
table.save(a,file='mytable1.tab')