Free Statistics

of Irreproducible Research!

Author's title

Author*Unverified author*
R Software Modulerwasp_autocorrelation.wasp
Title produced by software(Partial) Autocorrelation Function
Date of computationMon, 03 May 2010 17:50:21 +0000
Cite this page as followsStatistical Computations at FreeStatistics.org, Office for Research Development and Education, URL https://freestatistics.org/blog/index.php?v=date/2010/May/03/t1272909117iu4xu7dlxfhi4vr.htm/, Retrieved Thu, 25 Apr 2024 22:33:01 +0000
Statistical Computations at FreeStatistics.org, Office for Research Development and Education, URL https://freestatistics.org/blog/index.php?pk=75274, Retrieved Thu, 25 Apr 2024 22:33:01 +0000
QR Codes:

Original text written by user:
IsPrivate?No (this computation is public)
User-defined keywordsKDGP2W21
Estimated Impact151
Family? (F = Feedback message, R = changed R code, M = changed R Module, P = changed Parameters, D = changed Data)
-     [(Partial) Autocorrelation Function] [Nieuwe personenwagen] [2010-05-03 17:36:22] [f5ecd041e4b32af12787a4e421b18aaf]
-    D    [(Partial) Autocorrelation Function] [Personenwagen Aus...] [2010-05-03 17:50:21] [05b8da000f2ebbd12b039a4b088dd3f2] [Current]
Feedback Forum

Post a new message
Dataseries X:
40801
49081
52431
59650
75428
78705
68870
70641
80074
76464
69976
92917
92559
73981
71107
96942
86270
69610
57768
80077
71454
70382
69881
84530
79322
80181
82137
88439
91575
82909
73282
94089
108112
95653
85273
105093
102275
99308
79687
93263
114918
103374
65124
104045
101183
95492
85035
90692
107486
98179
82551
106804
110898
89950
65184
95357
98280
92146
77874
100039
104777
102341
71316
88838
85457
70784
70522
88629
88452
98886
79601
108135
113835
101617
68698
79182
86003
84165
68550
90385
100368
99081
81288
103491
111695
82504
62237
78249
92341
84412
75102
90461
106451
98379
72615
98367
116949
95832
68060
83923
87653
78054
57566
78784
88916
84662
63442
77773
88102
87972
61790
95276
104418
95420
82141
104064
96287
78426
59111
76837
76615
65860
57703
68656
77955
65856
60947
69885
80550
73694
67538
76326
84727


Summary of computational transaction
Raw Inputview raw input (R code)
Raw Outputview raw output of R engine
Computing time2 seconds
R Server'RServer@AstonUniversity' @ vre.aston.ac.uk

\begin{tabular}{lllllllll}
\hline
Summary of computational transaction \tabularnewline
Raw Input & view raw input (R code)  \tabularnewline
Raw Output & view raw output of R engine  \tabularnewline
Computing time & 2 seconds \tabularnewline
R Server & 'RServer@AstonUniversity' @ vre.aston.ac.uk \tabularnewline
\hline
\end{tabular}
%Source: https://freestatistics.org/blog/index.php?pk=75274&T=0

[TABLE]
[ROW][C]Summary of computational transaction[/C][/ROW]
[ROW][C]Raw Input[/C][C]view raw input (R code) [/C][/ROW]
[ROW][C]Raw Output[/C][C]view raw output of R engine [/C][/ROW]
[ROW][C]Computing time[/C][C]2 seconds[/C][/ROW]
[ROW][C]R Server[/C][C]'RServer@AstonUniversity' @ vre.aston.ac.uk[/C][/ROW]
[/TABLE]
Source: https://freestatistics.org/blog/index.php?pk=75274&T=0

Globally Unique Identifier (entire table): ba.freestatistics.org/blog/index.php?pk=75274&T=0

As an alternative you can also use a QR Code:  

The GUIDs for individual cells are displayed in the table below:

Summary of computational transaction
Raw Inputview raw input (R code)
Raw Outputview raw output of R engine
Computing time2 seconds
R Server'RServer@AstonUniversity' @ vre.aston.ac.uk


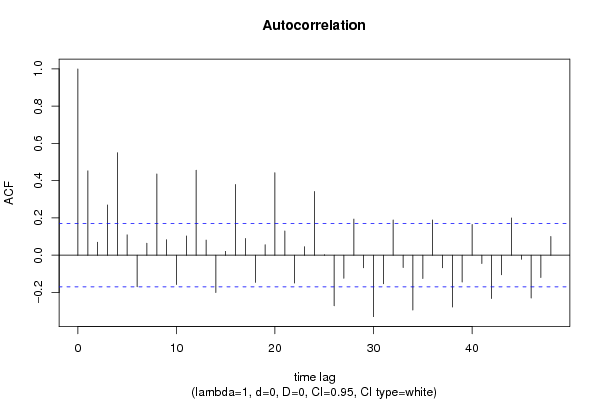
Autocorrelation Function
Time lag kACF(k)T-STATP-value
10.4530275.22460
20.06990.80610.210804
30.2701073.1150.001127
40.5497616.34010
50.1095161.2630.1044
6-0.168969-1.94860.026721
70.0648770.74820.227832
80.4359195.02731e-06
90.0836160.96430.16832
10-0.157652-1.81810.035647
110.1038091.19720.116683
120.4565.25890
130.081110.93540.175638
14-0.200683-2.31440.011089
150.0207870.23970.405456
160.3797664.37971.2e-05
170.0897041.03450.151387
18-0.146074-1.68460.047205
190.0567880.65490.256829
200.442725.10571e-06
210.1300511.49980.068016
22-0.149272-1.72150.043744
230.0454340.5240.300586
240.3423243.94796.4e-05
250.0021790.02510.489994
26-0.270958-3.12480.001092
27-0.123782-1.42750.077887
280.1939232.23640.013495
29-0.067482-0.77820.218904
30-0.329805-3.80350.000108
31-0.153381-1.76890.039604
320.1891082.18090.015475
33-0.065891-0.75990.224333
34-0.294639-3.39790.000448
35-0.125244-1.44440.075491
360.1895812.18640.01527
37-0.067945-0.78360.21734
38-0.277736-3.2030.000851
39-0.143974-1.66040.049597
400.1654451.9080.029273
41-0.04463-0.51470.303808
42-0.232947-2.68650.004071
43-0.1051-1.21210.113816
440.2002282.30910.011238
45-0.02222-0.25630.399076
46-0.229368-2.64520.004574
47-0.119572-1.3790.085109
480.1008561.16310.123429

\begin{tabular}{lllllllll}
\hline
Autocorrelation Function \tabularnewline
Time lag k & ACF(k) & T-STAT & P-value \tabularnewline
1 & 0.453027 & 5.2246 & 0 \tabularnewline
2 & 0.0699 & 0.8061 & 0.210804 \tabularnewline
3 & 0.270107 & 3.115 & 0.001127 \tabularnewline
4 & 0.549761 & 6.3401 & 0 \tabularnewline
5 & 0.109516 & 1.263 & 0.1044 \tabularnewline
6 & -0.168969 & -1.9486 & 0.026721 \tabularnewline
7 & 0.064877 & 0.7482 & 0.227832 \tabularnewline
8 & 0.435919 & 5.0273 & 1e-06 \tabularnewline
9 & 0.083616 & 0.9643 & 0.16832 \tabularnewline
10 & -0.157652 & -1.8181 & 0.035647 \tabularnewline
11 & 0.103809 & 1.1972 & 0.116683 \tabularnewline
12 & 0.456 & 5.2589 & 0 \tabularnewline
13 & 0.08111 & 0.9354 & 0.175638 \tabularnewline
14 & -0.200683 & -2.3144 & 0.011089 \tabularnewline
15 & 0.020787 & 0.2397 & 0.405456 \tabularnewline
16 & 0.379766 & 4.3797 & 1.2e-05 \tabularnewline
17 & 0.089704 & 1.0345 & 0.151387 \tabularnewline
18 & -0.146074 & -1.6846 & 0.047205 \tabularnewline
19 & 0.056788 & 0.6549 & 0.256829 \tabularnewline
20 & 0.44272 & 5.1057 & 1e-06 \tabularnewline
21 & 0.130051 & 1.4998 & 0.068016 \tabularnewline
22 & -0.149272 & -1.7215 & 0.043744 \tabularnewline
23 & 0.045434 & 0.524 & 0.300586 \tabularnewline
24 & 0.342324 & 3.9479 & 6.4e-05 \tabularnewline
25 & 0.002179 & 0.0251 & 0.489994 \tabularnewline
26 & -0.270958 & -3.1248 & 0.001092 \tabularnewline
27 & -0.123782 & -1.4275 & 0.077887 \tabularnewline
28 & 0.193923 & 2.2364 & 0.013495 \tabularnewline
29 & -0.067482 & -0.7782 & 0.218904 \tabularnewline
30 & -0.329805 & -3.8035 & 0.000108 \tabularnewline
31 & -0.153381 & -1.7689 & 0.039604 \tabularnewline
32 & 0.189108 & 2.1809 & 0.015475 \tabularnewline
33 & -0.065891 & -0.7599 & 0.224333 \tabularnewline
34 & -0.294639 & -3.3979 & 0.000448 \tabularnewline
35 & -0.125244 & -1.4444 & 0.075491 \tabularnewline
36 & 0.189581 & 2.1864 & 0.01527 \tabularnewline
37 & -0.067945 & -0.7836 & 0.21734 \tabularnewline
38 & -0.277736 & -3.203 & 0.000851 \tabularnewline
39 & -0.143974 & -1.6604 & 0.049597 \tabularnewline
40 & 0.165445 & 1.908 & 0.029273 \tabularnewline
41 & -0.04463 & -0.5147 & 0.303808 \tabularnewline
42 & -0.232947 & -2.6865 & 0.004071 \tabularnewline
43 & -0.1051 & -1.2121 & 0.113816 \tabularnewline
44 & 0.200228 & 2.3091 & 0.011238 \tabularnewline
45 & -0.02222 & -0.2563 & 0.399076 \tabularnewline
46 & -0.229368 & -2.6452 & 0.004574 \tabularnewline
47 & -0.119572 & -1.379 & 0.085109 \tabularnewline
48 & 0.100856 & 1.1631 & 0.123429 \tabularnewline
\hline
\end{tabular}
%Source: https://freestatistics.org/blog/index.php?pk=75274&T=1

[TABLE]
[ROW][C]Autocorrelation Function[/C][/ROW]
[ROW][C]Time lag k[/C][C]ACF(k)[/C][C]T-STAT[/C][C]P-value[/C][/ROW]
[ROW][C]1[/C][C]0.453027[/C][C]5.2246[/C][C]0[/C][/ROW]
[ROW][C]2[/C][C]0.0699[/C][C]0.8061[/C][C]0.210804[/C][/ROW]
[ROW][C]3[/C][C]0.270107[/C][C]3.115[/C][C]0.001127[/C][/ROW]
[ROW][C]4[/C][C]0.549761[/C][C]6.3401[/C][C]0[/C][/ROW]
[ROW][C]5[/C][C]0.109516[/C][C]1.263[/C][C]0.1044[/C][/ROW]
[ROW][C]6[/C][C]-0.168969[/C][C]-1.9486[/C][C]0.026721[/C][/ROW]
[ROW][C]7[/C][C]0.064877[/C][C]0.7482[/C][C]0.227832[/C][/ROW]
[ROW][C]8[/C][C]0.435919[/C][C]5.0273[/C][C]1e-06[/C][/ROW]
[ROW][C]9[/C][C]0.083616[/C][C]0.9643[/C][C]0.16832[/C][/ROW]
[ROW][C]10[/C][C]-0.157652[/C][C]-1.8181[/C][C]0.035647[/C][/ROW]
[ROW][C]11[/C][C]0.103809[/C][C]1.1972[/C][C]0.116683[/C][/ROW]
[ROW][C]12[/C][C]0.456[/C][C]5.2589[/C][C]0[/C][/ROW]
[ROW][C]13[/C][C]0.08111[/C][C]0.9354[/C][C]0.175638[/C][/ROW]
[ROW][C]14[/C][C]-0.200683[/C][C]-2.3144[/C][C]0.011089[/C][/ROW]
[ROW][C]15[/C][C]0.020787[/C][C]0.2397[/C][C]0.405456[/C][/ROW]
[ROW][C]16[/C][C]0.379766[/C][C]4.3797[/C][C]1.2e-05[/C][/ROW]
[ROW][C]17[/C][C]0.089704[/C][C]1.0345[/C][C]0.151387[/C][/ROW]
[ROW][C]18[/C][C]-0.146074[/C][C]-1.6846[/C][C]0.047205[/C][/ROW]
[ROW][C]19[/C][C]0.056788[/C][C]0.6549[/C][C]0.256829[/C][/ROW]
[ROW][C]20[/C][C]0.44272[/C][C]5.1057[/C][C]1e-06[/C][/ROW]
[ROW][C]21[/C][C]0.130051[/C][C]1.4998[/C][C]0.068016[/C][/ROW]
[ROW][C]22[/C][C]-0.149272[/C][C]-1.7215[/C][C]0.043744[/C][/ROW]
[ROW][C]23[/C][C]0.045434[/C][C]0.524[/C][C]0.300586[/C][/ROW]
[ROW][C]24[/C][C]0.342324[/C][C]3.9479[/C][C]6.4e-05[/C][/ROW]
[ROW][C]25[/C][C]0.002179[/C][C]0.0251[/C][C]0.489994[/C][/ROW]
[ROW][C]26[/C][C]-0.270958[/C][C]-3.1248[/C][C]0.001092[/C][/ROW]
[ROW][C]27[/C][C]-0.123782[/C][C]-1.4275[/C][C]0.077887[/C][/ROW]
[ROW][C]28[/C][C]0.193923[/C][C]2.2364[/C][C]0.013495[/C][/ROW]
[ROW][C]29[/C][C]-0.067482[/C][C]-0.7782[/C][C]0.218904[/C][/ROW]
[ROW][C]30[/C][C]-0.329805[/C][C]-3.8035[/C][C]0.000108[/C][/ROW]
[ROW][C]31[/C][C]-0.153381[/C][C]-1.7689[/C][C]0.039604[/C][/ROW]
[ROW][C]32[/C][C]0.189108[/C][C]2.1809[/C][C]0.015475[/C][/ROW]
[ROW][C]33[/C][C]-0.065891[/C][C]-0.7599[/C][C]0.224333[/C][/ROW]
[ROW][C]34[/C][C]-0.294639[/C][C]-3.3979[/C][C]0.000448[/C][/ROW]
[ROW][C]35[/C][C]-0.125244[/C][C]-1.4444[/C][C]0.075491[/C][/ROW]
[ROW][C]36[/C][C]0.189581[/C][C]2.1864[/C][C]0.01527[/C][/ROW]
[ROW][C]37[/C][C]-0.067945[/C][C]-0.7836[/C][C]0.21734[/C][/ROW]
[ROW][C]38[/C][C]-0.277736[/C][C]-3.203[/C][C]0.000851[/C][/ROW]
[ROW][C]39[/C][C]-0.143974[/C][C]-1.6604[/C][C]0.049597[/C][/ROW]
[ROW][C]40[/C][C]0.165445[/C][C]1.908[/C][C]0.029273[/C][/ROW]
[ROW][C]41[/C][C]-0.04463[/C][C]-0.5147[/C][C]0.303808[/C][/ROW]
[ROW][C]42[/C][C]-0.232947[/C][C]-2.6865[/C][C]0.004071[/C][/ROW]
[ROW][C]43[/C][C]-0.1051[/C][C]-1.2121[/C][C]0.113816[/C][/ROW]
[ROW][C]44[/C][C]0.200228[/C][C]2.3091[/C][C]0.011238[/C][/ROW]
[ROW][C]45[/C][C]-0.02222[/C][C]-0.2563[/C][C]0.399076[/C][/ROW]
[ROW][C]46[/C][C]-0.229368[/C][C]-2.6452[/C][C]0.004574[/C][/ROW]
[ROW][C]47[/C][C]-0.119572[/C][C]-1.379[/C][C]0.085109[/C][/ROW]
[ROW][C]48[/C][C]0.100856[/C][C]1.1631[/C][C]0.123429[/C][/ROW]
[/TABLE]
Source: https://freestatistics.org/blog/index.php?pk=75274&T=1

Globally Unique Identifier (entire table): ba.freestatistics.org/blog/index.php?pk=75274&T=1

As an alternative you can also use a QR Code:  

The GUIDs for individual cells are displayed in the table below:

Autocorrelation Function
Time lag kACF(k)T-STATP-value
10.4530275.22460
20.06990.80610.210804
30.2701073.1150.001127
40.5497616.34010
50.1095161.2630.1044
6-0.168969-1.94860.026721
70.0648770.74820.227832
80.4359195.02731e-06
90.0836160.96430.16832
10-0.157652-1.81810.035647
110.1038091.19720.116683
120.4565.25890
130.081110.93540.175638
14-0.200683-2.31440.011089
150.0207870.23970.405456
160.3797664.37971.2e-05
170.0897041.03450.151387
18-0.146074-1.68460.047205
190.0567880.65490.256829
200.442725.10571e-06
210.1300511.49980.068016
22-0.149272-1.72150.043744
230.0454340.5240.300586
240.3423243.94796.4e-05
250.0021790.02510.489994
26-0.270958-3.12480.001092
27-0.123782-1.42750.077887
280.1939232.23640.013495
29-0.067482-0.77820.218904
30-0.329805-3.80350.000108
31-0.153381-1.76890.039604
320.1891082.18090.015475
33-0.065891-0.75990.224333
34-0.294639-3.39790.000448
35-0.125244-1.44440.075491
360.1895812.18640.01527
37-0.067945-0.78360.21734
38-0.277736-3.2030.000851
39-0.143974-1.66040.049597
400.1654451.9080.029273
41-0.04463-0.51470.303808
42-0.232947-2.68650.004071
43-0.1051-1.21210.113816
440.2002282.30910.011238
45-0.02222-0.25630.399076
46-0.229368-2.64520.004574
47-0.119572-1.3790.085109
480.1008561.16310.123429


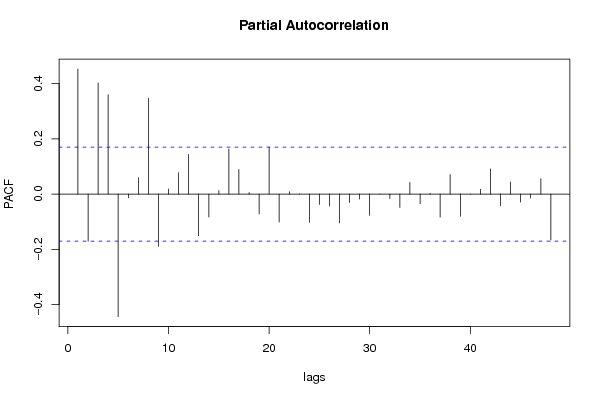
Partial Autocorrelation Function
Time lag kPACF(k)T-STATP-value
10.4530275.22460
2-0.170281-1.96380.025821
30.4019464.63554e-06
40.3597554.14893e-05
5-0.443465-5.11431e-06
6-0.013321-0.15360.439069
70.0590890.68140.248387
80.3473474.00585.1e-05
9-0.188712-2.17630.015648
100.0188790.21770.413988
110.0779360.89880.185191
120.1434851.65470.050167
13-0.150407-1.73460.042567
14-0.082685-0.95360.171015
150.0127810.14740.441519
160.1637091.8880.030603
170.089561.03290.151772
180.0056130.06470.474243
19-0.071646-0.82630.205067
200.1699631.96010.026037
21-0.101122-1.16620.12281
220.0085710.09880.460705
23-5.5e-05-6e-040.499746
24-0.101747-1.17340.121366
25-0.037255-0.42960.334076
26-0.042761-0.49310.311362
27-0.104208-1.20180.11579
28-0.030138-0.34760.364355
29-0.017431-0.2010.420495
30-0.077079-0.88890.187827
31-0.000366-0.00420.498318
32-0.015513-0.17890.429144
33-0.04812-0.5550.28993
340.0423910.48890.312869
35-0.034864-0.40210.344137
360.0023630.02730.48915
37-0.082947-0.95660.170254
380.0707120.81550.208124
39-0.080421-0.92750.177683
404e-061e-040.49998
410.0179850.20740.418
420.0909661.04910.148025
43-0.042443-0.48950.312654
440.0440920.50850.305974
45-0.02895-0.33390.369504
46-0.013927-0.16060.436322
470.0558990.64470.260128
48-0.166459-1.91970.028519

\begin{tabular}{lllllllll}
\hline
Partial Autocorrelation Function \tabularnewline
Time lag k & PACF(k) & T-STAT & P-value \tabularnewline
1 & 0.453027 & 5.2246 & 0 \tabularnewline
2 & -0.170281 & -1.9638 & 0.025821 \tabularnewline
3 & 0.401946 & 4.6355 & 4e-06 \tabularnewline
4 & 0.359755 & 4.1489 & 3e-05 \tabularnewline
5 & -0.443465 & -5.1143 & 1e-06 \tabularnewline
6 & -0.013321 & -0.1536 & 0.439069 \tabularnewline
7 & 0.059089 & 0.6814 & 0.248387 \tabularnewline
8 & 0.347347 & 4.0058 & 5.1e-05 \tabularnewline
9 & -0.188712 & -2.1763 & 0.015648 \tabularnewline
10 & 0.018879 & 0.2177 & 0.413988 \tabularnewline
11 & 0.077936 & 0.8988 & 0.185191 \tabularnewline
12 & 0.143485 & 1.6547 & 0.050167 \tabularnewline
13 & -0.150407 & -1.7346 & 0.042567 \tabularnewline
14 & -0.082685 & -0.9536 & 0.171015 \tabularnewline
15 & 0.012781 & 0.1474 & 0.441519 \tabularnewline
16 & 0.163709 & 1.888 & 0.030603 \tabularnewline
17 & 0.08956 & 1.0329 & 0.151772 \tabularnewline
18 & 0.005613 & 0.0647 & 0.474243 \tabularnewline
19 & -0.071646 & -0.8263 & 0.205067 \tabularnewline
20 & 0.169963 & 1.9601 & 0.026037 \tabularnewline
21 & -0.101122 & -1.1662 & 0.12281 \tabularnewline
22 & 0.008571 & 0.0988 & 0.460705 \tabularnewline
23 & -5.5e-05 & -6e-04 & 0.499746 \tabularnewline
24 & -0.101747 & -1.1734 & 0.121366 \tabularnewline
25 & -0.037255 & -0.4296 & 0.334076 \tabularnewline
26 & -0.042761 & -0.4931 & 0.311362 \tabularnewline
27 & -0.104208 & -1.2018 & 0.11579 \tabularnewline
28 & -0.030138 & -0.3476 & 0.364355 \tabularnewline
29 & -0.017431 & -0.201 & 0.420495 \tabularnewline
30 & -0.077079 & -0.8889 & 0.187827 \tabularnewline
31 & -0.000366 & -0.0042 & 0.498318 \tabularnewline
32 & -0.015513 & -0.1789 & 0.429144 \tabularnewline
33 & -0.04812 & -0.555 & 0.28993 \tabularnewline
34 & 0.042391 & 0.4889 & 0.312869 \tabularnewline
35 & -0.034864 & -0.4021 & 0.344137 \tabularnewline
36 & 0.002363 & 0.0273 & 0.48915 \tabularnewline
37 & -0.082947 & -0.9566 & 0.170254 \tabularnewline
38 & 0.070712 & 0.8155 & 0.208124 \tabularnewline
39 & -0.080421 & -0.9275 & 0.177683 \tabularnewline
40 & 4e-06 & 1e-04 & 0.49998 \tabularnewline
41 & 0.017985 & 0.2074 & 0.418 \tabularnewline
42 & 0.090966 & 1.0491 & 0.148025 \tabularnewline
43 & -0.042443 & -0.4895 & 0.312654 \tabularnewline
44 & 0.044092 & 0.5085 & 0.305974 \tabularnewline
45 & -0.02895 & -0.3339 & 0.369504 \tabularnewline
46 & -0.013927 & -0.1606 & 0.436322 \tabularnewline
47 & 0.055899 & 0.6447 & 0.260128 \tabularnewline
48 & -0.166459 & -1.9197 & 0.028519 \tabularnewline
\hline
\end{tabular}
%Source: https://freestatistics.org/blog/index.php?pk=75274&T=2

[TABLE]
[ROW][C]Partial Autocorrelation Function[/C][/ROW]
[ROW][C]Time lag k[/C][C]PACF(k)[/C][C]T-STAT[/C][C]P-value[/C][/ROW]
[ROW][C]1[/C][C]0.453027[/C][C]5.2246[/C][C]0[/C][/ROW]
[ROW][C]2[/C][C]-0.170281[/C][C]-1.9638[/C][C]0.025821[/C][/ROW]
[ROW][C]3[/C][C]0.401946[/C][C]4.6355[/C][C]4e-06[/C][/ROW]
[ROW][C]4[/C][C]0.359755[/C][C]4.1489[/C][C]3e-05[/C][/ROW]
[ROW][C]5[/C][C]-0.443465[/C][C]-5.1143[/C][C]1e-06[/C][/ROW]
[ROW][C]6[/C][C]-0.013321[/C][C]-0.1536[/C][C]0.439069[/C][/ROW]
[ROW][C]7[/C][C]0.059089[/C][C]0.6814[/C][C]0.248387[/C][/ROW]
[ROW][C]8[/C][C]0.347347[/C][C]4.0058[/C][C]5.1e-05[/C][/ROW]
[ROW][C]9[/C][C]-0.188712[/C][C]-2.1763[/C][C]0.015648[/C][/ROW]
[ROW][C]10[/C][C]0.018879[/C][C]0.2177[/C][C]0.413988[/C][/ROW]
[ROW][C]11[/C][C]0.077936[/C][C]0.8988[/C][C]0.185191[/C][/ROW]
[ROW][C]12[/C][C]0.143485[/C][C]1.6547[/C][C]0.050167[/C][/ROW]
[ROW][C]13[/C][C]-0.150407[/C][C]-1.7346[/C][C]0.042567[/C][/ROW]
[ROW][C]14[/C][C]-0.082685[/C][C]-0.9536[/C][C]0.171015[/C][/ROW]
[ROW][C]15[/C][C]0.012781[/C][C]0.1474[/C][C]0.441519[/C][/ROW]
[ROW][C]16[/C][C]0.163709[/C][C]1.888[/C][C]0.030603[/C][/ROW]
[ROW][C]17[/C][C]0.08956[/C][C]1.0329[/C][C]0.151772[/C][/ROW]
[ROW][C]18[/C][C]0.005613[/C][C]0.0647[/C][C]0.474243[/C][/ROW]
[ROW][C]19[/C][C]-0.071646[/C][C]-0.8263[/C][C]0.205067[/C][/ROW]
[ROW][C]20[/C][C]0.169963[/C][C]1.9601[/C][C]0.026037[/C][/ROW]
[ROW][C]21[/C][C]-0.101122[/C][C]-1.1662[/C][C]0.12281[/C][/ROW]
[ROW][C]22[/C][C]0.008571[/C][C]0.0988[/C][C]0.460705[/C][/ROW]
[ROW][C]23[/C][C]-5.5e-05[/C][C]-6e-04[/C][C]0.499746[/C][/ROW]
[ROW][C]24[/C][C]-0.101747[/C][C]-1.1734[/C][C]0.121366[/C][/ROW]
[ROW][C]25[/C][C]-0.037255[/C][C]-0.4296[/C][C]0.334076[/C][/ROW]
[ROW][C]26[/C][C]-0.042761[/C][C]-0.4931[/C][C]0.311362[/C][/ROW]
[ROW][C]27[/C][C]-0.104208[/C][C]-1.2018[/C][C]0.11579[/C][/ROW]
[ROW][C]28[/C][C]-0.030138[/C][C]-0.3476[/C][C]0.364355[/C][/ROW]
[ROW][C]29[/C][C]-0.017431[/C][C]-0.201[/C][C]0.420495[/C][/ROW]
[ROW][C]30[/C][C]-0.077079[/C][C]-0.8889[/C][C]0.187827[/C][/ROW]
[ROW][C]31[/C][C]-0.000366[/C][C]-0.0042[/C][C]0.498318[/C][/ROW]
[ROW][C]32[/C][C]-0.015513[/C][C]-0.1789[/C][C]0.429144[/C][/ROW]
[ROW][C]33[/C][C]-0.04812[/C][C]-0.555[/C][C]0.28993[/C][/ROW]
[ROW][C]34[/C][C]0.042391[/C][C]0.4889[/C][C]0.312869[/C][/ROW]
[ROW][C]35[/C][C]-0.034864[/C][C]-0.4021[/C][C]0.344137[/C][/ROW]
[ROW][C]36[/C][C]0.002363[/C][C]0.0273[/C][C]0.48915[/C][/ROW]
[ROW][C]37[/C][C]-0.082947[/C][C]-0.9566[/C][C]0.170254[/C][/ROW]
[ROW][C]38[/C][C]0.070712[/C][C]0.8155[/C][C]0.208124[/C][/ROW]
[ROW][C]39[/C][C]-0.080421[/C][C]-0.9275[/C][C]0.177683[/C][/ROW]
[ROW][C]40[/C][C]4e-06[/C][C]1e-04[/C][C]0.49998[/C][/ROW]
[ROW][C]41[/C][C]0.017985[/C][C]0.2074[/C][C]0.418[/C][/ROW]
[ROW][C]42[/C][C]0.090966[/C][C]1.0491[/C][C]0.148025[/C][/ROW]
[ROW][C]43[/C][C]-0.042443[/C][C]-0.4895[/C][C]0.312654[/C][/ROW]
[ROW][C]44[/C][C]0.044092[/C][C]0.5085[/C][C]0.305974[/C][/ROW]
[ROW][C]45[/C][C]-0.02895[/C][C]-0.3339[/C][C]0.369504[/C][/ROW]
[ROW][C]46[/C][C]-0.013927[/C][C]-0.1606[/C][C]0.436322[/C][/ROW]
[ROW][C]47[/C][C]0.055899[/C][C]0.6447[/C][C]0.260128[/C][/ROW]
[ROW][C]48[/C][C]-0.166459[/C][C]-1.9197[/C][C]0.028519[/C][/ROW]
[/TABLE]
Source: https://freestatistics.org/blog/index.php?pk=75274&T=2

Globally Unique Identifier (entire table): ba.freestatistics.org/blog/index.php?pk=75274&T=2

As an alternative you can also use a QR Code:  

The GUIDs for individual cells are displayed in the table below:

Partial Autocorrelation Function
Time lag kPACF(k)T-STATP-value
10.4530275.22460
2-0.170281-1.96380.025821
30.4019464.63554e-06
40.3597554.14893e-05
5-0.443465-5.11431e-06
6-0.013321-0.15360.439069
70.0590890.68140.248387
80.3473474.00585.1e-05
9-0.188712-2.17630.015648
100.0188790.21770.413988
110.0779360.89880.185191
120.1434851.65470.050167
13-0.150407-1.73460.042567
14-0.082685-0.95360.171015
150.0127810.14740.441519
160.1637091.8880.030603
170.089561.03290.151772
180.0056130.06470.474243
19-0.071646-0.82630.205067
200.1699631.96010.026037
21-0.101122-1.16620.12281
220.0085710.09880.460705
23-5.5e-05-6e-040.499746
24-0.101747-1.17340.121366
25-0.037255-0.42960.334076
26-0.042761-0.49310.311362
27-0.104208-1.20180.11579
28-0.030138-0.34760.364355
29-0.017431-0.2010.420495
30-0.077079-0.88890.187827
31-0.000366-0.00420.498318
32-0.015513-0.17890.429144
33-0.04812-0.5550.28993
340.0423910.48890.312869
35-0.034864-0.40210.344137
360.0023630.02730.48915
37-0.082947-0.95660.170254
380.0707120.81550.208124
39-0.080421-0.92750.177683
404e-061e-040.49998
410.0179850.20740.418
420.0909661.04910.148025
43-0.042443-0.48950.312654
440.0440920.50850.305974
45-0.02895-0.33390.369504
46-0.013927-0.16060.436322
470.0558990.64470.260128
48-0.166459-1.91970.028519


Parameters (Session):
par1 = 48 ; par2 = 1 ; par3 = 0 ; par4 = 0 ; par5 = 12 ; par6 = White Noise ; par7 = 0.95 ;
Parameters (R input):
par1 = 48 ; par2 = 1 ; par3 = 0 ; par4 = 0 ; par5 = 12 ; par6 = White Noise ; par7 = 0.95 ;
R code (references can be found in the software module):
if (par1 == 'Default') {
par1 = 10*log10(length(x))
} else {
par1 <- as.numeric(par1)
}
par2 <- as.numeric(par2)
par3 <- as.numeric(par3)
par4 <- as.numeric(par4)
par5 <- as.numeric(par5)
if (par6 == 'White Noise') par6 <- 'white' else par6 <- 'ma'
par7 <- as.numeric(par7)
if (par2 == 0) {
x <- log(x)
} else {
x <- (x ^ par2 - 1) / par2
}
if (par3 > 0) x <- diff(x,lag=1,difference=par3)
if (par4 > 0) x <- diff(x,lag=par5,difference=par4)
bitmap(file='pic1.png')
racf <- acf(x, par1, main='Autocorrelation', xlab='time lag', ylab='ACF', ci.type=par6, ci=par7, sub=paste('(lambda=',par2,', d=',par3,', D=',par4,', CI=', par7, ', CI type=',par6,')',sep=''))
dev.off()
bitmap(file='pic2.png')
rpacf <- pacf(x,par1,main='Partial Autocorrelation',xlab='lags',ylab='PACF')
dev.off()
(myacf <- c(racf$acf))
(mypacf <- c(rpacf$acf))
lengthx <- length(x)
sqrtn <- sqrt(lengthx)
load(file='createtable')
a<-table.start()
a<-table.row.start(a)
a<-table.element(a,'Autocorrelation Function',4,TRUE)
a<-table.row.end(a)
a<-table.row.start(a)
a<-table.element(a,'Time lag k',header=TRUE)
a<-table.element(a,hyperlink('basics.htm','ACF(k)','click here for more information about the Autocorrelation Function'),header=TRUE)
a<-table.element(a,'T-STAT',header=TRUE)
a<-table.element(a,'P-value',header=TRUE)
a<-table.row.end(a)
for (i in 2:(par1+1)) {
a<-table.row.start(a)
a<-table.element(a,i-1,header=TRUE)
a<-table.element(a,round(myacf[i],6))
mytstat <- myacf[i]*sqrtn
a<-table.element(a,round(mytstat,4))
a<-table.element(a,round(1-pt(abs(mytstat),lengthx),6))
a<-table.row.end(a)
}
a<-table.end(a)
table.save(a,file='mytable.tab')
a<-table.start()
a<-table.row.start(a)
a<-table.element(a,'Partial Autocorrelation Function',4,TRUE)
a<-table.row.end(a)
a<-table.row.start(a)
a<-table.element(a,'Time lag k',header=TRUE)
a<-table.element(a,hyperlink('basics.htm','PACF(k)','click here for more information about the Partial Autocorrelation Function'),header=TRUE)
a<-table.element(a,'T-STAT',header=TRUE)
a<-table.element(a,'P-value',header=TRUE)
a<-table.row.end(a)
for (i in 1:par1) {
a<-table.row.start(a)
a<-table.element(a,i,header=TRUE)
a<-table.element(a,round(mypacf[i],6))
mytstat <- mypacf[i]*sqrtn
a<-table.element(a,round(mytstat,4))
a<-table.element(a,round(1-pt(abs(mytstat),lengthx),6))
a<-table.row.end(a)
}
a<-table.end(a)
table.save(a,file='mytable1.tab')