| Tabulation of Results | ||
| A x B | ||
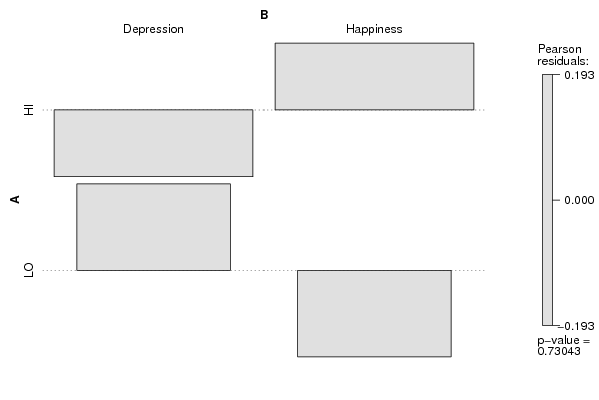
| Depression | Happiness | HI | 100 | 103 | LO | 62 | 59 |
| Tabulation of Expected Results | ||
| A x B | ||
| Depression | Happiness | HI | 101.5 | 101.5 | LO | 60.5 | 60.5 |
| Statistical Results | |
| Pearson's Chi-squared test with Yates' continuity correction | |
| Chi Square Statistic | 0.05 |
| Degrees of Freedom | 1 |
| P value | 0.82 |