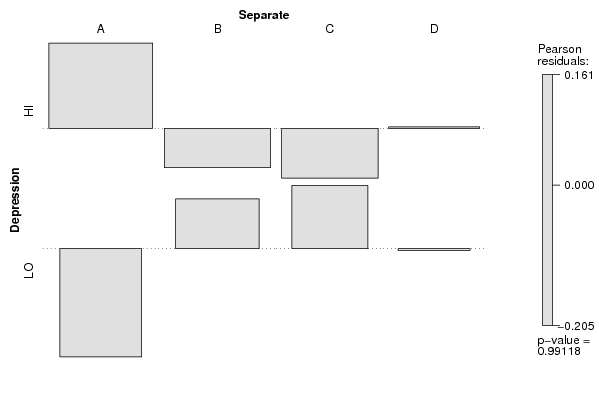
| Tabulation of Results | ||||
| Depression x Separate | ||||
| A | B | C | D | HI | 28 | 28 | 23 | 21 | LO | 16 | 18 | 15 | 13 |
| Tabulation of Expected Results | ||||
| Depression x Separate | ||||
| A | B | C | D | HI | 27.16 | 28.4 | 23.46 | 20.99 | LO | 16.84 | 17.6 | 14.54 | 13.01 |
| Statistical Results | |
| Pearson's Chi-squared test | |
| Chi Square Statistic | 0.11 |
| Degrees of Freedom | 3 |
| P value | 0.99 |