| Multiple Linear Regression - Estimated Regression Equation |
| Eendagsattracties[t] = -81.283726637103 -0.0643130276182469Bioscoop[t] -0.427201176091097Schouwburgabonnement[t] + 0.42473910932952HuurvaneenDVD[t] + 1.8217064126921`And.dienstenrecr.&cultuur`[t] -0.104368938422877t + e[t] |
| Multiple Linear Regression - Ordinary Least Squares | |||||
| Variable | Parameter | S.D. | T-STAT H0: parameter = 0 | 2-tail p-value | 1-tail p-value |
| (Intercept) | -81.283726637103 | 45.490792 | -1.7868 | 0.079797 | 0.039898 |
| Bioscoop | -0.0643130276182469 | 0.096705 | -0.665 | 0.508961 | 0.254481 |
| Schouwburgabonnement | -0.427201176091097 | 0.103081 | -4.1443 | 0.000126 | 6.3e-05 |
| HuurvaneenDVD | 0.42473910932952 | 0.339972 | 1.2493 | 0.217137 | 0.108569 |
| `And.dienstenrecr.&cultuur` | 1.8217064126921 | 0.465457 | 3.9138 | 0.000265 | 0.000133 |
| t | -0.104368938422877 | 0.104995 | -0.994 | 0.324808 | 0.162404 |
| Multiple Linear Regression - Regression Statistics | |
| Multiple R | 0.979106475949625 |
| R-squared | 0.958649491246493 |
| Adjusted R-squared | 0.954673480789425 |
| F-TEST (value) | 241.108392846992 |
| F-TEST (DF numerator) | 5 |
| F-TEST (DF denominator) | 52 |
| p-value | 0 |
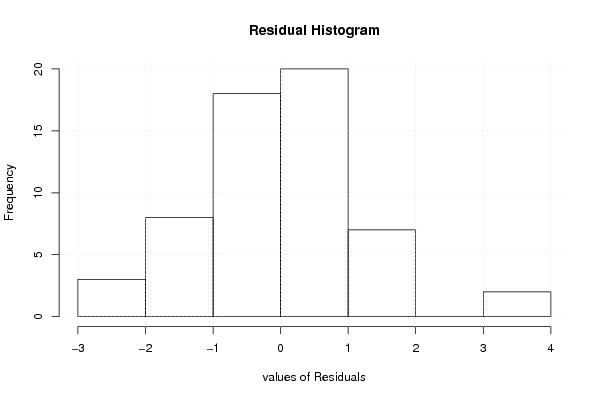
| Multiple Linear Regression - Residual Statistics | |
| Residual Standard Deviation | 1.14802596690307 |
| Sum Squared Residuals | 68.5341082755535 |
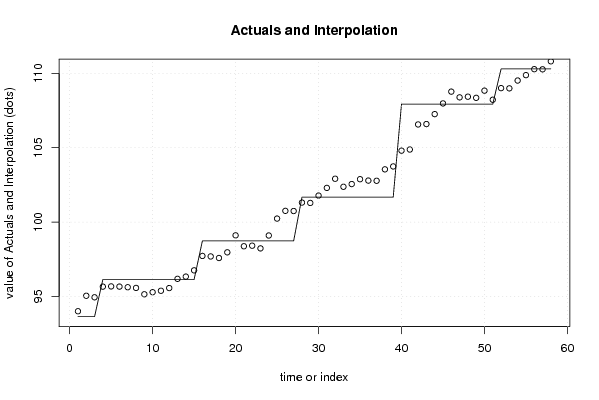
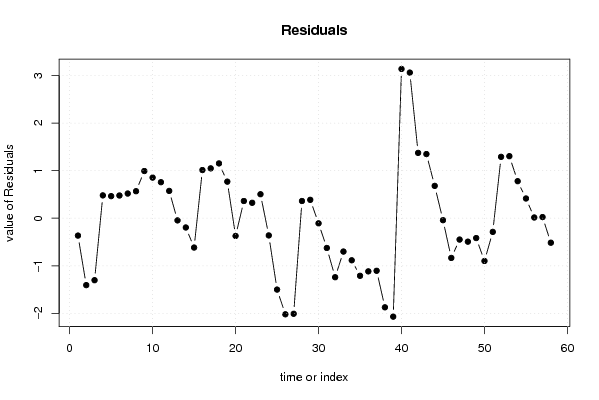
| Multiple Linear Regression - Actuals, Interpolation, and Residuals | |||
| Time or Index | Actuals | Interpolation Forecast | Residuals Prediction Error |
| 1 | 93.63 | 93.9948223328667 | -0.36482233286675 |
| 2 | 93.63 | 95.0361824766126 | -1.40618247661258 |
| 3 | 93.63 | 94.9330410379434 | -1.30304103794344 |
| 4 | 96.13 | 95.6493227552534 | 0.480677244746571 |
| 5 | 96.13 | 95.6651082671966 | 0.464891732803438 |
| 6 | 96.13 | 95.6518246494083 | 0.478175350591712 |
| 7 | 96.13 | 95.6106016855528 | 0.51939831444723 |
| 8 | 96.13 | 95.5615465474323 | 0.568453452567691 |
| 9 | 96.13 | 95.1368608291306 | 0.993139170869396 |
| 10 | 96.13 | 95.2756638780289 | 0.854336121971097 |
| 11 | 96.13 | 95.3722475368342 | 0.757752463165774 |
| 12 | 96.13 | 95.5550201736117 | 0.574979826388338 |
| 13 | 96.13 | 96.1750617885047 | -0.0450617885047232 |
| 14 | 96.13 | 96.324504248105 | -0.194504248104989 |
| 15 | 96.13 | 96.7462014811103 | -0.616201481110303 |
| 16 | 98.73 | 97.7166393261758 | 1.01336067382424 |
| 17 | 98.73 | 97.6814561449993 | 1.04854385500067 |
| 18 | 98.73 | 97.5770872065765 | 1.15291279342355 |
| 19 | 98.73 | 97.9602716229462 | 0.769728377053766 |
| 20 | 98.73 | 99.1019303275868 | -0.371930327586841 |
| 21 | 98.73 | 98.367719646908 | 0.362280353091971 |
| 22 | 98.73 | 98.404794725961 | 0.325205274038938 |
| 23 | 98.73 | 98.2253956797918 | 0.5046043202082 |
| 24 | 98.73 | 99.0914518848166 | -0.361451884816633 |
| 25 | 98.73 | 100.230299893836 | -1.50029989383562 |
| 26 | 98.73 | 100.749558526821 | -2.01955852682136 |
| 27 | 98.73 | 100.738632192451 | -2.00863219245097 |
| 28 | 101.67 | 101.307443765958 | 0.362556234041603 |
| 29 | 101.67 | 101.282374386805 | 0.387625613194959 |
| 30 | 101.67 | 101.777278456895 | -0.107278456895125 |
| 31 | 101.67 | 102.295211874038 | -0.62521187403754 |
| 32 | 101.67 | 102.910303528492 | -1.24030352849159 |
| 33 | 101.67 | 102.370613689498 | -0.700613689498008 |
| 34 | 101.67 | 102.553866830508 | -0.883866830508186 |
| 35 | 101.67 | 102.880261247275 | -1.21026124727486 |
| 36 | 101.67 | 102.787171939184 | -1.11717193918363 |
| 37 | 101.67 | 102.774453213227 | -1.10445321322742 |
| 38 | 101.67 | 103.5431132271 | -1.8731132270996 |
| 39 | 101.67 | 103.739276988726 | -2.06927698872611 |
| 40 | 107.94 | 104.800800154426 | 3.13919984557381 |
| 41 | 107.94 | 104.877374357519 | 3.06262564248121 |
| 42 | 107.94 | 106.56577096936 | 1.37422903064019 |
| 43 | 107.94 | 106.590616155322 | 1.3493838446784 |
| 44 | 107.94 | 107.259303782709 | 0.680696217290513 |
| 45 | 107.94 | 107.980846376675 | -0.0408463766750154 |
| 46 | 107.94 | 108.774288874514 | -0.834288874513695 |
| 47 | 107.94 | 108.388169192 | -0.448169192000423 |
| 48 | 107.94 | 108.43212294405 | -0.4921229440501 |
| 49 | 107.94 | 108.356470570567 | -0.416470570566868 |
| 50 | 107.94 | 108.838861361416 | -0.898861361416381 |
| 51 | 107.94 | 108.226810210424 | -0.286810210424231 |
| 52 | 110.3 | 109.009211003291 | 1.29078899670928 |
| 53 | 110.3 | 108.994970973588 | 1.30502902641233 |
| 54 | 110.3 | 109.520825221283 | 0.779174778717133 |
| 55 | 110.3 | 109.884566298514 | 0.415433701485716 |
| 56 | 110.3 | 110.284235372966 | 0.0157646270339175 |
| 57 | 110.3 | 110.275436039255 | 0.0245639607449071 |
| 58 | 110.3 | 110.814704127954 | -0.514704127953556 |
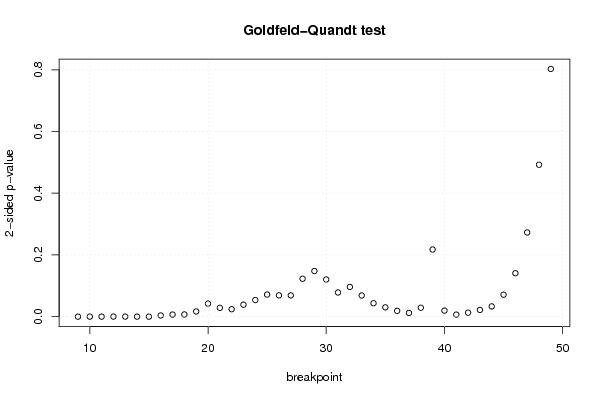
| Goldfeld-Quandt test for Heteroskedasticity | |||
| p-values | Alternative Hypothesis | ||
| breakpoint index | greater | 2-sided | less |
| 9 | 1.0932548537229e-06 | 2.18650970744581e-06 | 0.999998906745146 |
| 10 | 2.72627639846001e-05 | 5.45255279692002e-05 | 0.999972737236015 |
| 11 | 1.94194921276017e-06 | 3.88389842552035e-06 | 0.999998058050787 |
| 12 | 0.000129628563667612 | 0.000259257127335225 | 0.999870371436332 |
| 13 | 0.000135996284332359 | 0.000271992568664717 | 0.999864003715668 |
| 14 | 4.43212445887518e-05 | 8.86424891775037e-05 | 0.999955678755411 |
| 15 | 1.20419053190271e-05 | 2.40838106380542e-05 | 0.99998795809468 |
| 16 | 0.00189565021843934 | 0.00379130043687867 | 0.99810434978156 |
| 17 | 0.00336397917477558 | 0.00672795834955117 | 0.996636020825224 |
| 18 | 0.00357456635014568 | 0.00714913270029137 | 0.996425433649854 |
| 19 | 0.00839592042299005 | 0.0167918408459801 | 0.99160407957701 |
| 20 | 0.0211809525179049 | 0.0423619050358097 | 0.978819047482095 |
| 21 | 0.0142925881942979 | 0.0285851763885957 | 0.985707411805702 |
| 22 | 0.0120434143548136 | 0.0240868287096272 | 0.987956585645186 |
| 23 | 0.0193608526231059 | 0.0387217052462119 | 0.980639147376894 |
| 24 | 0.0268757893722252 | 0.0537515787444504 | 0.973124210627775 |
| 25 | 0.0358242437613217 | 0.0716484875226433 | 0.964175756238678 |
| 26 | 0.0345272490420184 | 0.0690544980840368 | 0.965472750957982 |
| 27 | 0.0344891919089543 | 0.0689783838179087 | 0.965510808091046 |
| 28 | 0.0614132999912679 | 0.122826599982536 | 0.938586700008732 |
| 29 | 0.0739229086773515 | 0.147845817354703 | 0.926077091322648 |
| 30 | 0.0601811785720765 | 0.120362357144153 | 0.939818821427924 |
| 31 | 0.0391411307707481 | 0.0782822615414962 | 0.960858869229252 |
| 32 | 0.0481533815257214 | 0.0963067630514428 | 0.951846618474279 |
| 33 | 0.0343473684596218 | 0.0686947369192436 | 0.965652631540378 |
| 34 | 0.0217587037109314 | 0.0435174074218629 | 0.978241296289069 |
| 35 | 0.0150751671450438 | 0.0301503342900876 | 0.984924832854956 |
| 36 | 0.00945630986349538 | 0.0189126197269908 | 0.990543690136505 |
| 37 | 0.00600007216164375 | 0.0120001443232875 | 0.993999927838356 |
| 38 | 0.0144188564293422 | 0.0288377128586843 | 0.985581143570658 |
| 39 | 0.891203534637522 | 0.217592930724956 | 0.108796465362478 |
| 40 | 0.990248313136087 | 0.0195033737278263 | 0.00975168686391314 |
| 41 | 0.996741500303598 | 0.0065169993928033 | 0.00325849969640165 |
| 42 | 0.99358077727859 | 0.0128384454428215 | 0.00641922272141073 |
| 43 | 0.989081913732802 | 0.0218361725343956 | 0.0109180862671978 |
| 44 | 0.983393597228527 | 0.0332128055429467 | 0.0166064027714734 |
| 45 | 0.96437892246074 | 0.0712421550785191 | 0.0356210775392595 |
| 46 | 0.929629632264859 | 0.140740735470283 | 0.0703703677351414 |
| 47 | 0.863605069069171 | 0.272789861861658 | 0.136394930930829 |
| 48 | 0.753818479673416 | 0.492363040653169 | 0.246181520326584 |
| 49 | 0.598597997326502 | 0.802804005346995 | 0.401402002673498 |
| Meta Analysis of Goldfeld-Quandt test for Heteroskedasticity | |||
| Description | # significant tests | % significant tests | OK/NOK |
| 1% type I error level | 11 | 0.268292682926829 | NOK |
| 5% type I error level | 25 | 0.609756097560976 | NOK |
| 10% type I error level | 33 | 0.804878048780488 | NOK |