| Multiple Linear Regression - Estimated Regression Equation |
| uitvoer[t] = + 748.072152423624 + 0.892597476409893invoer[t] + 241.389011880087M1[t] + 995.458410491878M2[t] + 1101.31078858059M3[t] + 827.408828727138M4[t] + 1101.50543825314M5[t] + 1536.18475816057M6[t] + 1526.30536759173M7[t] -67.6231584650186M8[t] + 1333.38498903394M9[t] + 1149.19652200137M10[t] + 766.137395534915M11[t] + e[t] |
| Multiple Linear Regression - Ordinary Least Squares | |||||
| Variable | Parameter | S.D. | T-STAT H0: parameter = 0 | 2-tail p-value | 1-tail p-value |
| (Intercept) | 748.072152423624 | 789.350269 | 0.9477 | 0.3487 | 0.17435 |
| invoer | 0.892597476409893 | 0.043991 | 20.2907 | 0 | 0 |
| M1 | 241.389011880087 | 385.223723 | 0.6266 | 0.534299 | 0.26715 |
| M2 | 995.458410491878 | 384.844169 | 2.5867 | 0.013247 | 0.006623 |
| M3 | 1101.31078858059 | 394.32318 | 2.7929 | 0.007833 | 0.003916 |
| M4 | 827.408828727138 | 385.614746 | 2.1457 | 0.037724 | 0.018862 |
| M5 | 1101.50543825314 | 385.648539 | 2.8562 | 0.006637 | 0.003319 |
| M6 | 1536.18475816057 | 392.311749 | 3.9157 | 0.000325 | 0.000163 |
| M7 | 1526.30536759173 | 384.901578 | 3.9654 | 0.00028 | 0.00014 |
| M8 | -67.6231584650186 | 406.976247 | -0.1662 | 0.868828 | 0.434414 |
| M9 | 1333.38498903394 | 410.424128 | 3.2488 | 0.002284 | 0.001142 |
| M10 | 1149.19652200137 | 415.779622 | 2.764 | 0.008443 | 0.004222 |
| M11 | 766.137395534915 | 407.67852 | 1.8793 | 0.067158 | 0.033579 |
| Multiple Linear Regression - Regression Statistics | |
| Multiple R | 0.968101963445662 |
| R-squared | 0.937221411627346 |
| Adjusted R-squared | 0.919284672092302 |
| F-TEST (value) | 52.2514925188187 |
| F-TEST (DF numerator) | 12 |
| F-TEST (DF denominator) | 42 |
| p-value | 0 |
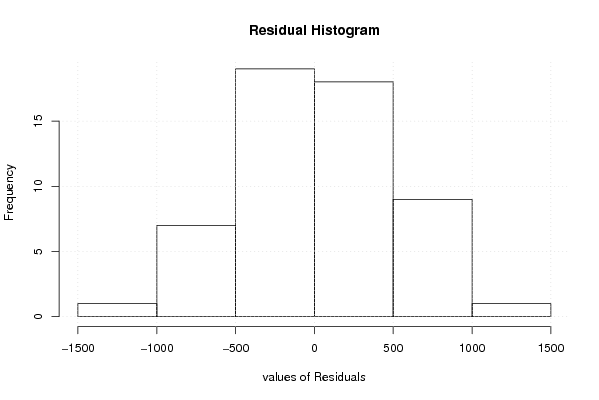
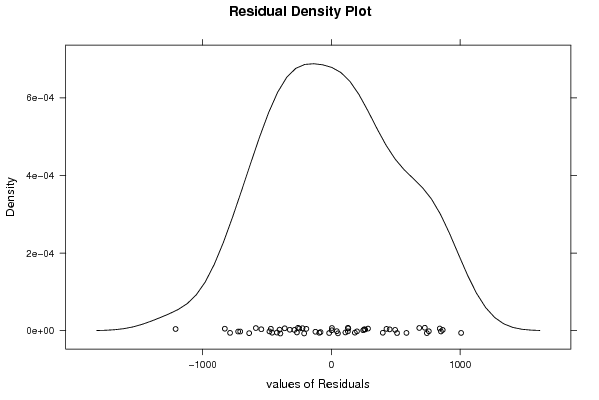
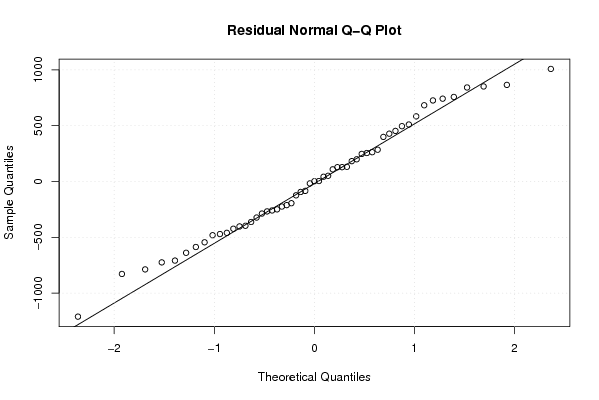
| Multiple Linear Regression - Residual Statistics | |
| Residual Standard Deviation | 573.625168812105 |
| Sum Squared Residuals | 13819925.0403781 |
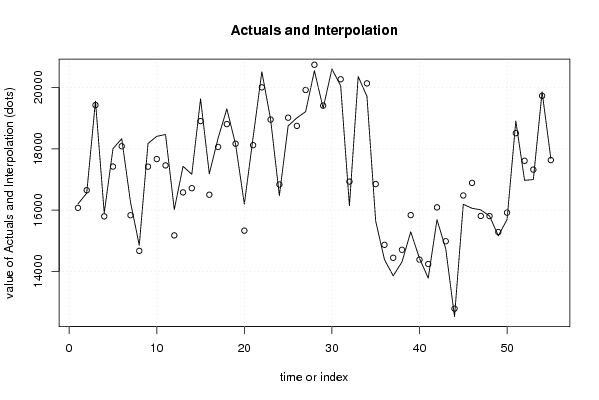
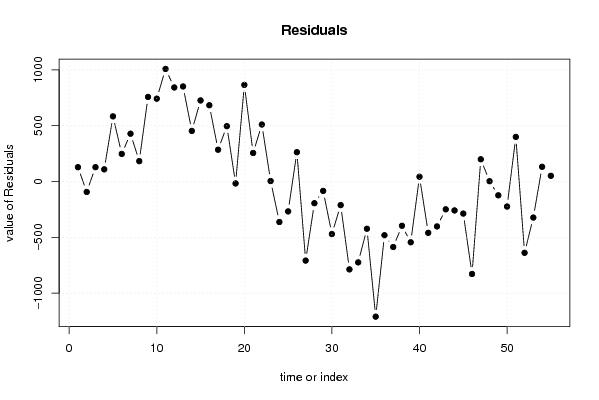
| Multiple Linear Regression - Actuals, Interpolation, and Residuals | |||
| Time or Index | Actuals | Interpolation Forecast | Residuals Prediction Error |
| 1 | 16198.9 | 16070.9666452205 | 127.933354779463 |
| 2 | 16554.2 | 16648.1232240079 | -93.9232240078967 |
| 3 | 19554.2 | 19426.0554074773 | 128.14459252274 |
| 4 | 15903.8 | 15795.1835985938 | 108.616401406153 |
| 5 | 18003.8 | 17420.5835276568 | 583.216472343212 |
| 6 | 18329.6 | 18082.6966845535 | 246.903315446544 |
| 7 | 16260.7 | 15832.7546671864 | 427.94533281365 |
| 8 | 14851.9 | 14669.8614624879 | 182.038537512062 |
| 9 | 18174.1 | 17416.9958641607 | 757.104135839344 |
| 10 | 18406.6 | 17664.9138354581 | 741.686164541883 |
| 11 | 18466.5 | 17458.5890093208 | 1007.91099067918 |
| 12 | 16016.5 | 15174.5003454032 | 841.999654596761 |
| 13 | 17428.5 | 16577.4264533355 | 851.07354666448 |
| 14 | 17167.2 | 16714.2646970099 | 452.935302990131 |
| 15 | 19630 | 18904.1536630204 | 725.846336979601 |
| 16 | 17183.6 | 16500.8711634435 | 682.728836556491 |
| 17 | 18344.7 | 18060.3081389998 | 284.391861000242 |
| 18 | 19301.4 | 18806.1469391837 | 495.253060816329 |
| 19 | 18147.5 | 18165.0226132978 | -17.5226132977622 |
| 20 | 16192.9 | 15327.8843220973 | 865.015677902687 |
| 21 | 18374.4 | 18119.3808183476 | 255.0191816524 |
| 22 | 20515.2 | 20005.0366393619 | 510.16336063807 |
| 23 | 18957.2 | 18953.1542238215 | 4.04577617845619 |
| 24 | 16471.5 | 16834.3746125351 | -362.874612535079 |
| 25 | 18746.8 | 19014.842382168 | -268.042382168018 |
| 26 | 19009.5 | 18747.1554495334 | 262.344550466598 |
| 27 | 19211.2 | 19919.7510716796 | -708.551071679574 |
| 28 | 20547.7 | 20742.4943713433 | -194.79437134332 |
| 29 | 19325.8 | 19410.1833025744 | -84.3833025744407 |
| 30 | 20605.5 | 21076.290100937 | -470.790100936955 |
| 31 | 20056.9 | 20268.6963457006 | -211.796345700597 |
| 32 | 16141.4 | 16928.9364155337 | -787.536415533736 |
| 33 | 20359.8 | 21084.411115486 | -724.611115485986 |
| 34 | 19711.6 | 20135.0880916749 | -423.488091674855 |
| 35 | 15638.6 | 16849.3912316711 | -1210.79123167107 |
| 36 | 14384.5 | 14866.1079173036 | -481.607917303621 |
| 37 | 13855.6 | 14442.5118092583 | -586.911809258338 |
| 38 | 14308.3 | 14705.0277776112 | -396.727777611202 |
| 39 | 15290.6 | 15835.3142793755 | -544.714279375542 |
| 40 | 14423.8 | 14381.4877154559 | 42.3122845441422 |
| 41 | 13779.7 | 14239.7231607225 | -460.023160722492 |
| 42 | 15686.3 | 16089.080220992 | -402.780220991957 |
| 43 | 14733.8 | 14983.3589086347 | -249.558908634698 |
| 44 | 12522.5 | 12782.017799881 | -259.517799881014 |
| 45 | 16189.4 | 16476.9122020058 | -287.512202005757 |
| 46 | 16059.1 | 16887.4614335051 | -828.361433505098 |
| 47 | 16007.1 | 15808.2655351866 | 198.834464813433 |
| 48 | 15806.8 | 15804.3171247581 | 2.48287524193745 |
| 49 | 15160 | 15284.0527100176 | -124.052710017586 |
| 50 | 15692.1 | 15916.7288518376 | -224.628851837631 |
| 51 | 18908.9 | 18509.6255784472 | 399.274421552776 |
| 52 | 16969.9 | 17608.7631511635 | -638.863151163466 |
| 53 | 16997.5 | 17320.7018700465 | -323.201870046522 |
| 54 | 19858.9 | 19727.486054334 | 131.413945666039 |
| 55 | 17681.2 | 17630.2674651806 | 50.9325348194077 |
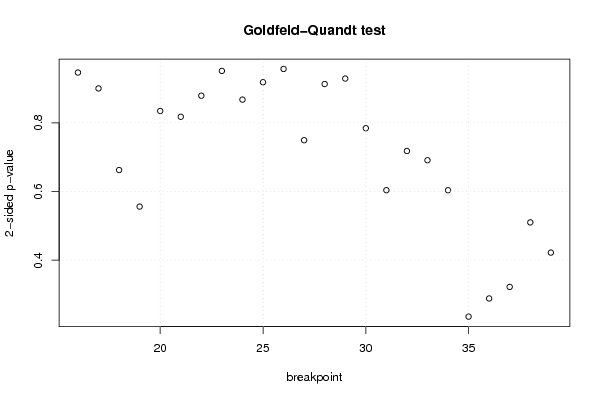
| Goldfeld-Quandt test for Heteroskedasticity | |||
| p-values | Alternative Hypothesis | ||
| breakpoint index | greater | 2-sided | less |
| 16 | 0.526849618858244 | 0.946300762283512 | 0.473150381141756 |
| 17 | 0.4500495750939 | 0.9000991501878 | 0.5499504249061 |
| 18 | 0.33128934338609 | 0.66257868677218 | 0.66871065661391 |
| 19 | 0.278063006951384 | 0.556126013902768 | 0.721936993048616 |
| 20 | 0.417214911669489 | 0.834429823338978 | 0.582785088330511 |
| 21 | 0.408796061128732 | 0.817592122257463 | 0.591203938871268 |
| 22 | 0.439449735936874 | 0.878899471873748 | 0.560550264063126 |
| 23 | 0.524452584219057 | 0.951094831561887 | 0.475547415780943 |
| 24 | 0.56624950960972 | 0.86750098078056 | 0.43375049039028 |
| 25 | 0.459049058346652 | 0.918098116693304 | 0.540950941653348 |
| 26 | 0.478391393319817 | 0.956782786639635 | 0.521608606680183 |
| 27 | 0.625332686395399 | 0.749334627209203 | 0.374667313604601 |
| 28 | 0.543588323458132 | 0.912823353083736 | 0.456411676541868 |
| 29 | 0.464429975360673 | 0.928859950721347 | 0.535570024639327 |
| 30 | 0.392113969508405 | 0.78422793901681 | 0.607886030491595 |
| 31 | 0.301919182497791 | 0.603838364995581 | 0.698080817502209 |
| 32 | 0.359003840931022 | 0.718007681862045 | 0.640996159068978 |
| 33 | 0.345541602215006 | 0.691083204430012 | 0.654458397784994 |
| 34 | 0.301862209367581 | 0.603724418735161 | 0.698137790632419 |
| 35 | 0.882129696486649 | 0.235740607026702 | 0.117870303513351 |
| 36 | 0.855645456549728 | 0.288709086900544 | 0.144354543450272 |
| 37 | 0.838831392586348 | 0.322337214827304 | 0.161168607413652 |
| 38 | 0.744962096951866 | 0.510075806096268 | 0.255037903048134 |
| 39 | 0.788903496238349 | 0.422193007523303 | 0.211096503761651 |
| Meta Analysis of Goldfeld-Quandt test for Heteroskedasticity | |||
| Description | # significant tests | % significant tests | OK/NOK |
| 1% type I error level | 0 | 0 | OK |
| 5% type I error level | 0 | 0 | OK |
| 10% type I error level | 0 | 0 | OK |