| Tabulation of Results | ||||
| Popularity x WeightedPopularity | ||||
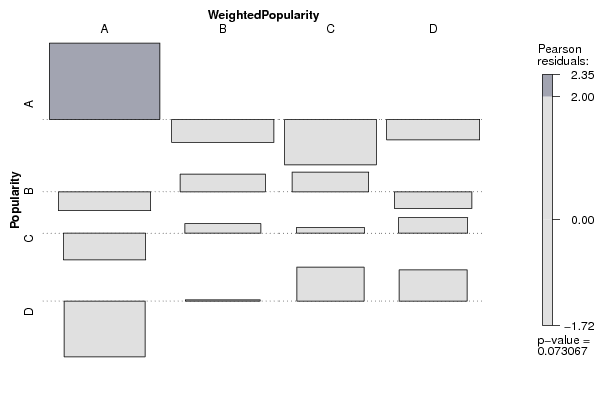
| A | B | C | D | A | 27 | 12 | 7 | 10 | B | 10 | 12 | 10 | 7 | C | 7 | 9 | 7 | 8 | D | 4 | 8 | 9 | 9 |
| Tabulation of Expected Results | ||||
| Popularity x WeightedPopularity | ||||
| A | B | C | D | A | 17.23 | 14.72 | 11.85 | 12.21 | B | 12 | 10.25 | 8.25 | 8.5 | C | 9.54 | 8.15 | 6.56 | 6.76 | D | 9.23 | 7.88 | 6.35 | 6.54 |
| Statistical Results | |
| Pearson's Chi-squared test with simulated p-value (based on 2000 replicates) | |
| Chi Square Statistic | 15.72 |
| P value | 0.07 |