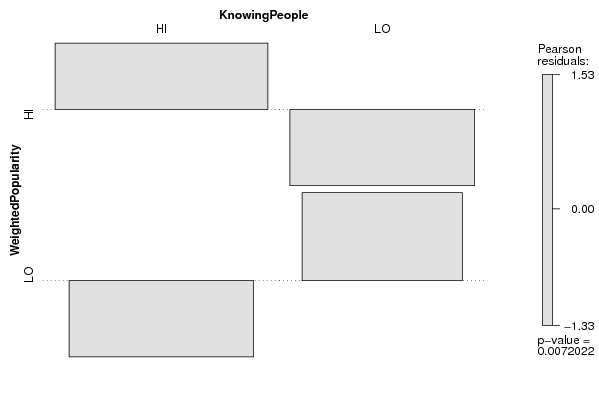
| Tabulation of Results | ||
| WeightedPopularity x KnowingPeople | ||
| HI | LO | HI | 59 | 30 | LO | 30 | 37 |
| Tabulation of Expected Results | ||
| WeightedPopularity x KnowingPeople | ||
| HI | LO | HI | 50.78 | 38.22 | LO | 38.22 | 28.78 |
| Statistical Results | |
| Pearson's Chi-squared test with Yates' continuity correction | |
| Chi Square Statistic | 6.37 |
| Degrees of Freedom | 1 |
| P value | 0.01 |