Free Statistics

of Irreproducible Research!

Author's title

Author*The author of this computation has been verified*
R Software Modulerwasp_centraltendency.wasp
Title produced by softwareCentral Tendency
Date of computationThu, 25 Nov 2010 08:57:09 +0000
Cite this page as followsStatistical Computations at FreeStatistics.org, Office for Research Development and Education, URL https://freestatistics.org/blog/index.php?v=date/2010/Nov/25/t1290675405otalx9chzlm8i58.htm/, Retrieved Fri, 19 Apr 2024 11:47:47 +0000
Statistical Computations at FreeStatistics.org, Office for Research Development and Education, URL https://freestatistics.org/blog/index.php?pk=100632, Retrieved Fri, 19 Apr 2024 11:47:47 +0000
QR Codes:

Original text written by user:
IsPrivate?No (this computation is public)
User-defined keywords
Estimated Impact164
Family? (F = Feedback message, R = changed R code, M = changed R Module, P = changed Parameters, D = changed Data)
-     [Central Tendency] [Arabica Price in ...] [2008-01-06 21:28:17] [74be16979710d4c4e7c6647856088456]
-  M D    [Central Tendency] [Prijsindexcijfers...] [2010-11-25 08:57:09] [f0b33ae54e73edcd25a3e2f31270d1c9] [Current]
Feedback Forum

Post a new message
Dataseries X:
180,9
187
189,9
193,8
194,5
198,7
204,7
213,2
214,7
211
213,2
206,2
210,8
216,2
213,3
213,1
238,5
253
262,7
263,2
263,2
267,9
268
248,4
230,8
190,6
173,5
164,7
161,6
157,6
158,4
167
176,8
184,4
183,6
197
195,4
201,7
207,6
215,3
218,6
210,6
216,5
243,7
233,2
230,4
246,6
256,1
264,8
271,5


Summary of computational transaction
Raw Inputview raw input (R code)
Raw Outputview raw output of R engine
Computing time2 seconds
R Server'George Udny Yule' @ 72.249.76.132

\begin{tabular}{lllllllll}
\hline
Summary of computational transaction \tabularnewline
Raw Input & view raw input (R code)  \tabularnewline
Raw Output & view raw output of R engine  \tabularnewline
Computing time & 2 seconds \tabularnewline
R Server & 'George Udny Yule' @ 72.249.76.132 \tabularnewline
\hline
\end{tabular}
%Source: https://freestatistics.org/blog/index.php?pk=100632&T=0

[TABLE]
[ROW][C]Summary of computational transaction[/C][/ROW]
[ROW][C]Raw Input[/C][C]view raw input (R code) [/C][/ROW]
[ROW][C]Raw Output[/C][C]view raw output of R engine [/C][/ROW]
[ROW][C]Computing time[/C][C]2 seconds[/C][/ROW]
[ROW][C]R Server[/C][C]'George Udny Yule' @ 72.249.76.132[/C][/ROW]
[/TABLE]
Source: https://freestatistics.org/blog/index.php?pk=100632&T=0

Globally Unique Identifier (entire table): ba.freestatistics.org/blog/index.php?pk=100632&T=0

As an alternative you can also use a QR Code:  

The GUIDs for individual cells are displayed in the table below:

Summary of computational transaction
Raw Inputview raw input (R code)
Raw Outputview raw output of R engine
Computing time2 seconds
R Server'George Udny Yule' @ 72.249.76.132


Central Tendency - Ungrouped Data
MeasureValueS.E.Value/S.E.
Arithmetic Mean213.6824.5336570722739547.1323694301438
Geometric Mean211.325551872648
Harmonic Mean208.977333005805
Quadratic Mean216.025797996443
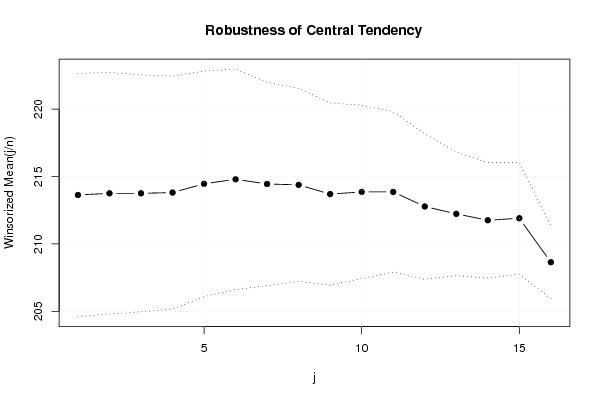
Winsorized Mean ( 1 / 16 )213.6284.5119207548403647.3474627786451
Winsorized Mean ( 2 / 16 )213.7524.4797396425803747.7152729967309
Winsorized Mean ( 3 / 16 )213.7524.3914222883122648.6748907225113
Winsorized Mean ( 4 / 16 )213.8084.3199828419916349.4927891661322
Winsorized Mean ( 5 / 16 )214.4584.1830621436884251.2681840798333
Winsorized Mean ( 6 / 16 )214.7944.0916504429067252.495686764339
Winsorized Mean ( 7 / 16 )214.4443.7702391630954656.878089352808
Winsorized Mean ( 8 / 16 )214.383.5825985324758359.8392474224145
Winsorized Mean ( 9 / 16 )213.6963.3792656610813063.2374076004493
Winsorized Mean ( 10 / 16 )213.8563.2137207884510566.5446733171472
Winsorized Mean ( 11 / 16 )213.8562.9751448738520571.8808693585099
Winsorized Mean ( 12 / 16 )212.7762.6977837616254278.870665257397
Winsorized Mean ( 13 / 16 )212.232.2968270038717192.4013866269636
Winsorized Mean ( 14 / 16 )211.7542.141001501300698.9041809972413
Winsorized Mean ( 15 / 16 )211.9042.07507454500963102.118740991551
Winsorized Mean ( 16 / 16 )208.641.34870459390952154.696588817281
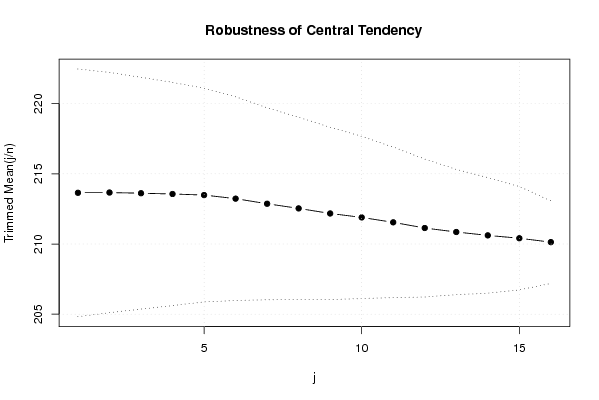
Trimmed Mean ( 1 / 16 )213.6458333333334.4097148135676148.4489002953201
Trimmed Mean ( 2 / 16 )213.6652173913044.2768190100073749.9589103236183
Trimmed Mean ( 3 / 16 )213.6159090909094.1260810527582351.7721068392755
Trimmed Mean ( 4 / 16 )213.5619047619053.9742009947682753.7370669080509
Trimmed Mean ( 5 / 16 )213.4853.8033007762826056.1315059096282
Trimmed Mean ( 6 / 16 )213.2289473684213.6266633656540658.794800032389
Trimmed Mean ( 7 / 16 )212.8666666666673.4172183062223262.2923815780407
Trimmed Mean ( 8 / 16 )212.5352941176473.245561571926365.4849058961169
Trimmed Mean ( 9 / 16 )212.1753.0684364779729269.1475940672456
Trimmed Mean ( 10 / 16 )211.8933333333332.8875274127507473.3822759214874
Trimmed Mean ( 11 / 16 )211.5428571428572.6790951868883278.9605603332658
Trimmed Mean ( 12 / 16 )211.1384615384622.4556000483859685.9824309244661
Trimmed Mean ( 13 / 16 )210.8541666666672.2308198529203594.5186884501852
Trimmed Mean ( 14 / 16 )210.6136363636362.05740448700310102.368609427126
Trimmed Mean ( 15 / 16 )210.411.84079359316344114.303961498696
Trimmed Mean ( 16 / 16 )210.1333333333331.47013849332044142.934379507830
Median212.05
Midrange214.55
Midmean - Weighted Average at Xnp210.044
Midmean - Weighted Average at X(n+1)p211.138461538462
Midmean - Empirical Distribution Function211.138461538462
Midmean - Empirical Distribution Function - Averaging211.138461538462
Midmean - Empirical Distribution Function - Interpolation210.854166666667
Midmean - Closest Observation211.138461538462
Midmean - True Basic - Statistics Graphics Toolkit211.138461538462
Midmean - MS Excel (old versions)211.138461538462
Number of observations50

\begin{tabular}{lllllllll}
\hline
Central Tendency - Ungrouped Data \tabularnewline
Measure & Value & S.E. & Value/S.E. \tabularnewline
Arithmetic Mean & 213.682 & 4.53365707227395 & 47.1323694301438 \tabularnewline
Geometric Mean & 211.325551872648 &  &  \tabularnewline
Harmonic Mean & 208.977333005805 &  &  \tabularnewline
Quadratic Mean & 216.025797996443 &  &  \tabularnewline
Winsorized Mean ( 1 / 16 ) & 213.628 & 4.51192075484036 & 47.3474627786451 \tabularnewline
Winsorized Mean ( 2 / 16 ) & 213.752 & 4.47973964258037 & 47.7152729967309 \tabularnewline
Winsorized Mean ( 3 / 16 ) & 213.752 & 4.39142228831226 & 48.6748907225113 \tabularnewline
Winsorized Mean ( 4 / 16 ) & 213.808 & 4.31998284199163 & 49.4927891661322 \tabularnewline
Winsorized Mean ( 5 / 16 ) & 214.458 & 4.18306214368842 & 51.2681840798333 \tabularnewline
Winsorized Mean ( 6 / 16 ) & 214.794 & 4.09165044290672 & 52.495686764339 \tabularnewline
Winsorized Mean ( 7 / 16 ) & 214.444 & 3.77023916309546 & 56.878089352808 \tabularnewline
Winsorized Mean ( 8 / 16 ) & 214.38 & 3.58259853247583 & 59.8392474224145 \tabularnewline
Winsorized Mean ( 9 / 16 ) & 213.696 & 3.37926566108130 & 63.2374076004493 \tabularnewline
Winsorized Mean ( 10 / 16 ) & 213.856 & 3.21372078845105 & 66.5446733171472 \tabularnewline
Winsorized Mean ( 11 / 16 ) & 213.856 & 2.97514487385205 & 71.8808693585099 \tabularnewline
Winsorized Mean ( 12 / 16 ) & 212.776 & 2.69778376162542 & 78.870665257397 \tabularnewline
Winsorized Mean ( 13 / 16 ) & 212.23 & 2.29682700387171 & 92.4013866269636 \tabularnewline
Winsorized Mean ( 14 / 16 ) & 211.754 & 2.1410015013006 & 98.9041809972413 \tabularnewline
Winsorized Mean ( 15 / 16 ) & 211.904 & 2.07507454500963 & 102.118740991551 \tabularnewline
Winsorized Mean ( 16 / 16 ) & 208.64 & 1.34870459390952 & 154.696588817281 \tabularnewline
Trimmed Mean ( 1 / 16 ) & 213.645833333333 & 4.40971481356761 & 48.4489002953201 \tabularnewline
Trimmed Mean ( 2 / 16 ) & 213.665217391304 & 4.27681901000737 & 49.9589103236183 \tabularnewline
Trimmed Mean ( 3 / 16 ) & 213.615909090909 & 4.12608105275823 & 51.7721068392755 \tabularnewline
Trimmed Mean ( 4 / 16 ) & 213.561904761905 & 3.97420099476827 & 53.7370669080509 \tabularnewline
Trimmed Mean ( 5 / 16 ) & 213.485 & 3.80330077628260 & 56.1315059096282 \tabularnewline
Trimmed Mean ( 6 / 16 ) & 213.228947368421 & 3.62666336565406 & 58.794800032389 \tabularnewline
Trimmed Mean ( 7 / 16 ) & 212.866666666667 & 3.41721830622232 & 62.2923815780407 \tabularnewline
Trimmed Mean ( 8 / 16 ) & 212.535294117647 & 3.2455615719263 & 65.4849058961169 \tabularnewline
Trimmed Mean ( 9 / 16 ) & 212.175 & 3.06843647797292 & 69.1475940672456 \tabularnewline
Trimmed Mean ( 10 / 16 ) & 211.893333333333 & 2.88752741275074 & 73.3822759214874 \tabularnewline
Trimmed Mean ( 11 / 16 ) & 211.542857142857 & 2.67909518688832 & 78.9605603332658 \tabularnewline
Trimmed Mean ( 12 / 16 ) & 211.138461538462 & 2.45560004838596 & 85.9824309244661 \tabularnewline
Trimmed Mean ( 13 / 16 ) & 210.854166666667 & 2.23081985292035 & 94.5186884501852 \tabularnewline
Trimmed Mean ( 14 / 16 ) & 210.613636363636 & 2.05740448700310 & 102.368609427126 \tabularnewline
Trimmed Mean ( 15 / 16 ) & 210.41 & 1.84079359316344 & 114.303961498696 \tabularnewline
Trimmed Mean ( 16 / 16 ) & 210.133333333333 & 1.47013849332044 & 142.934379507830 \tabularnewline
Median & 212.05 &  &  \tabularnewline
Midrange & 214.55 &  &  \tabularnewline
Midmean - Weighted Average at Xnp & 210.044 &  &  \tabularnewline
Midmean - Weighted Average at X(n+1)p & 211.138461538462 &  &  \tabularnewline
Midmean - Empirical Distribution Function & 211.138461538462 &  &  \tabularnewline
Midmean - Empirical Distribution Function - Averaging & 211.138461538462 &  &  \tabularnewline
Midmean - Empirical Distribution Function - Interpolation & 210.854166666667 &  &  \tabularnewline
Midmean - Closest Observation & 211.138461538462 &  &  \tabularnewline
Midmean - True Basic - Statistics Graphics Toolkit & 211.138461538462 &  &  \tabularnewline
Midmean - MS Excel (old versions) & 211.138461538462 &  &  \tabularnewline
Number of observations & 50 &  &  \tabularnewline
\hline
\end{tabular}
%Source: https://freestatistics.org/blog/index.php?pk=100632&T=1

[TABLE]
[ROW][C]Central Tendency - Ungrouped Data[/C][/ROW]
[ROW][C]Measure[/C][C]Value[/C][C]S.E.[/C][C]Value/S.E.[/C][/ROW]
[ROW][C]Arithmetic Mean[/C][C]213.682[/C][C]4.53365707227395[/C][C]47.1323694301438[/C][/ROW]
[ROW][C]Geometric Mean[/C][C]211.325551872648[/C][C][/C][C][/C][/ROW]
[ROW][C]Harmonic Mean[/C][C]208.977333005805[/C][C][/C][C][/C][/ROW]
[ROW][C]Quadratic Mean[/C][C]216.025797996443[/C][C][/C][C][/C][/ROW]
[ROW][C]Winsorized Mean ( 1 / 16 )[/C][C]213.628[/C][C]4.51192075484036[/C][C]47.3474627786451[/C][/ROW]
[ROW][C]Winsorized Mean ( 2 / 16 )[/C][C]213.752[/C][C]4.47973964258037[/C][C]47.7152729967309[/C][/ROW]
[ROW][C]Winsorized Mean ( 3 / 16 )[/C][C]213.752[/C][C]4.39142228831226[/C][C]48.6748907225113[/C][/ROW]
[ROW][C]Winsorized Mean ( 4 / 16 )[/C][C]213.808[/C][C]4.31998284199163[/C][C]49.4927891661322[/C][/ROW]
[ROW][C]Winsorized Mean ( 5 / 16 )[/C][C]214.458[/C][C]4.18306214368842[/C][C]51.2681840798333[/C][/ROW]
[ROW][C]Winsorized Mean ( 6 / 16 )[/C][C]214.794[/C][C]4.09165044290672[/C][C]52.495686764339[/C][/ROW]
[ROW][C]Winsorized Mean ( 7 / 16 )[/C][C]214.444[/C][C]3.77023916309546[/C][C]56.878089352808[/C][/ROW]
[ROW][C]Winsorized Mean ( 8 / 16 )[/C][C]214.38[/C][C]3.58259853247583[/C][C]59.8392474224145[/C][/ROW]
[ROW][C]Winsorized Mean ( 9 / 16 )[/C][C]213.696[/C][C]3.37926566108130[/C][C]63.2374076004493[/C][/ROW]
[ROW][C]Winsorized Mean ( 10 / 16 )[/C][C]213.856[/C][C]3.21372078845105[/C][C]66.5446733171472[/C][/ROW]
[ROW][C]Winsorized Mean ( 11 / 16 )[/C][C]213.856[/C][C]2.97514487385205[/C][C]71.8808693585099[/C][/ROW]
[ROW][C]Winsorized Mean ( 12 / 16 )[/C][C]212.776[/C][C]2.69778376162542[/C][C]78.870665257397[/C][/ROW]
[ROW][C]Winsorized Mean ( 13 / 16 )[/C][C]212.23[/C][C]2.29682700387171[/C][C]92.4013866269636[/C][/ROW]
[ROW][C]Winsorized Mean ( 14 / 16 )[/C][C]211.754[/C][C]2.1410015013006[/C][C]98.9041809972413[/C][/ROW]
[ROW][C]Winsorized Mean ( 15 / 16 )[/C][C]211.904[/C][C]2.07507454500963[/C][C]102.118740991551[/C][/ROW]
[ROW][C]Winsorized Mean ( 16 / 16 )[/C][C]208.64[/C][C]1.34870459390952[/C][C]154.696588817281[/C][/ROW]
[ROW][C]Trimmed Mean ( 1 / 16 )[/C][C]213.645833333333[/C][C]4.40971481356761[/C][C]48.4489002953201[/C][/ROW]
[ROW][C]Trimmed Mean ( 2 / 16 )[/C][C]213.665217391304[/C][C]4.27681901000737[/C][C]49.9589103236183[/C][/ROW]
[ROW][C]Trimmed Mean ( 3 / 16 )[/C][C]213.615909090909[/C][C]4.12608105275823[/C][C]51.7721068392755[/C][/ROW]
[ROW][C]Trimmed Mean ( 4 / 16 )[/C][C]213.561904761905[/C][C]3.97420099476827[/C][C]53.7370669080509[/C][/ROW]
[ROW][C]Trimmed Mean ( 5 / 16 )[/C][C]213.485[/C][C]3.80330077628260[/C][C]56.1315059096282[/C][/ROW]
[ROW][C]Trimmed Mean ( 6 / 16 )[/C][C]213.228947368421[/C][C]3.62666336565406[/C][C]58.794800032389[/C][/ROW]
[ROW][C]Trimmed Mean ( 7 / 16 )[/C][C]212.866666666667[/C][C]3.41721830622232[/C][C]62.2923815780407[/C][/ROW]
[ROW][C]Trimmed Mean ( 8 / 16 )[/C][C]212.535294117647[/C][C]3.2455615719263[/C][C]65.4849058961169[/C][/ROW]
[ROW][C]Trimmed Mean ( 9 / 16 )[/C][C]212.175[/C][C]3.06843647797292[/C][C]69.1475940672456[/C][/ROW]
[ROW][C]Trimmed Mean ( 10 / 16 )[/C][C]211.893333333333[/C][C]2.88752741275074[/C][C]73.3822759214874[/C][/ROW]
[ROW][C]Trimmed Mean ( 11 / 16 )[/C][C]211.542857142857[/C][C]2.67909518688832[/C][C]78.9605603332658[/C][/ROW]
[ROW][C]Trimmed Mean ( 12 / 16 )[/C][C]211.138461538462[/C][C]2.45560004838596[/C][C]85.9824309244661[/C][/ROW]
[ROW][C]Trimmed Mean ( 13 / 16 )[/C][C]210.854166666667[/C][C]2.23081985292035[/C][C]94.5186884501852[/C][/ROW]
[ROW][C]Trimmed Mean ( 14 / 16 )[/C][C]210.613636363636[/C][C]2.05740448700310[/C][C]102.368609427126[/C][/ROW]
[ROW][C]Trimmed Mean ( 15 / 16 )[/C][C]210.41[/C][C]1.84079359316344[/C][C]114.303961498696[/C][/ROW]
[ROW][C]Trimmed Mean ( 16 / 16 )[/C][C]210.133333333333[/C][C]1.47013849332044[/C][C]142.934379507830[/C][/ROW]
[ROW][C]Median[/C][C]212.05[/C][C][/C][C][/C][/ROW]
[ROW][C]Midrange[/C][C]214.55[/C][C][/C][C][/C][/ROW]
[ROW][C]Midmean - Weighted Average at Xnp[/C][C]210.044[/C][C][/C][C][/C][/ROW]
[ROW][C]Midmean - Weighted Average at X(n+1)p[/C][C]211.138461538462[/C][C][/C][C][/C][/ROW]
[ROW][C]Midmean - Empirical Distribution Function[/C][C]211.138461538462[/C][C][/C][C][/C][/ROW]
[ROW][C]Midmean - Empirical Distribution Function - Averaging[/C][C]211.138461538462[/C][C][/C][C][/C][/ROW]
[ROW][C]Midmean - Empirical Distribution Function - Interpolation[/C][C]210.854166666667[/C][C][/C][C][/C][/ROW]
[ROW][C]Midmean - Closest Observation[/C][C]211.138461538462[/C][C][/C][C][/C][/ROW]
[ROW][C]Midmean - True Basic - Statistics Graphics Toolkit[/C][C]211.138461538462[/C][C][/C][C][/C][/ROW]
[ROW][C]Midmean - MS Excel (old versions)[/C][C]211.138461538462[/C][C][/C][C][/C][/ROW]
[ROW][C]Number of observations[/C][C]50[/C][C][/C][C][/C][/ROW]
[/TABLE]
Source: https://freestatistics.org/blog/index.php?pk=100632&T=1

Globally Unique Identifier (entire table): ba.freestatistics.org/blog/index.php?pk=100632&T=1

As an alternative you can also use a QR Code:  

The GUIDs for individual cells are displayed in the table below:

Central Tendency - Ungrouped Data
MeasureValueS.E.Value/S.E.
Arithmetic Mean213.6824.5336570722739547.1323694301438
Geometric Mean211.325551872648
Harmonic Mean208.977333005805
Quadratic Mean216.025797996443
Winsorized Mean ( 1 / 16 )213.6284.5119207548403647.3474627786451
Winsorized Mean ( 2 / 16 )213.7524.4797396425803747.7152729967309
Winsorized Mean ( 3 / 16 )213.7524.3914222883122648.6748907225113
Winsorized Mean ( 4 / 16 )213.8084.3199828419916349.4927891661322
Winsorized Mean ( 5 / 16 )214.4584.1830621436884251.2681840798333
Winsorized Mean ( 6 / 16 )214.7944.0916504429067252.495686764339
Winsorized Mean ( 7 / 16 )214.4443.7702391630954656.878089352808
Winsorized Mean ( 8 / 16 )214.383.5825985324758359.8392474224145
Winsorized Mean ( 9 / 16 )213.6963.3792656610813063.2374076004493
Winsorized Mean ( 10 / 16 )213.8563.2137207884510566.5446733171472
Winsorized Mean ( 11 / 16 )213.8562.9751448738520571.8808693585099
Winsorized Mean ( 12 / 16 )212.7762.6977837616254278.870665257397
Winsorized Mean ( 13 / 16 )212.232.2968270038717192.4013866269636
Winsorized Mean ( 14 / 16 )211.7542.141001501300698.9041809972413
Winsorized Mean ( 15 / 16 )211.9042.07507454500963102.118740991551
Winsorized Mean ( 16 / 16 )208.641.34870459390952154.696588817281
Trimmed Mean ( 1 / 16 )213.6458333333334.4097148135676148.4489002953201
Trimmed Mean ( 2 / 16 )213.6652173913044.2768190100073749.9589103236183
Trimmed Mean ( 3 / 16 )213.6159090909094.1260810527582351.7721068392755
Trimmed Mean ( 4 / 16 )213.5619047619053.9742009947682753.7370669080509
Trimmed Mean ( 5 / 16 )213.4853.8033007762826056.1315059096282
Trimmed Mean ( 6 / 16 )213.2289473684213.6266633656540658.794800032389
Trimmed Mean ( 7 / 16 )212.8666666666673.4172183062223262.2923815780407
Trimmed Mean ( 8 / 16 )212.5352941176473.245561571926365.4849058961169
Trimmed Mean ( 9 / 16 )212.1753.0684364779729269.1475940672456
Trimmed Mean ( 10 / 16 )211.8933333333332.8875274127507473.3822759214874
Trimmed Mean ( 11 / 16 )211.5428571428572.6790951868883278.9605603332658
Trimmed Mean ( 12 / 16 )211.1384615384622.4556000483859685.9824309244661
Trimmed Mean ( 13 / 16 )210.8541666666672.2308198529203594.5186884501852
Trimmed Mean ( 14 / 16 )210.6136363636362.05740448700310102.368609427126
Trimmed Mean ( 15 / 16 )210.411.84079359316344114.303961498696
Trimmed Mean ( 16 / 16 )210.1333333333331.47013849332044142.934379507830
Median212.05
Midrange214.55
Midmean - Weighted Average at Xnp210.044
Midmean - Weighted Average at X(n+1)p211.138461538462
Midmean - Empirical Distribution Function211.138461538462
Midmean - Empirical Distribution Function - Averaging211.138461538462
Midmean - Empirical Distribution Function - Interpolation210.854166666667
Midmean - Closest Observation211.138461538462
Midmean - True Basic - Statistics Graphics Toolkit211.138461538462
Midmean - MS Excel (old versions)211.138461538462
Number of observations50


Parameters (Session):
Parameters (R input):
R code (references can be found in the software module):
geomean <- function(x) {
return(exp(mean(log(x))))
}
harmean <- function(x) {
return(1/mean(1/x))
}
quamean <- function(x) {
return(sqrt(mean(x*x)))
}
winmean <- function(x) {
x <-sort(x[!is.na(x)])
n<-length(x)
denom <- 3
nodenom <- n/denom
if (nodenom>40) denom <- n/40
sqrtn = sqrt(n)
roundnodenom = floor(nodenom)
win <- array(NA,dim=c(roundnodenom,2))
for (j in 1:roundnodenom) {
win[j,1] <- (j*x[j+1]+sum(x[(j+1):(n-j)])+j*x[n-j])/n
win[j,2] <- sd(c(rep(x[j+1],j),x[(j+1):(n-j)],rep(x[n-j],j)))/sqrtn
}
return(win)
}
trimean <- function(x) {
x <-sort(x[!is.na(x)])
n<-length(x)
denom <- 3
nodenom <- n/denom
if (nodenom>40) denom <- n/40
sqrtn = sqrt(n)
roundnodenom = floor(nodenom)
tri <- array(NA,dim=c(roundnodenom,2))
for (j in 1:roundnodenom) {
tri[j,1] <- mean(x,trim=j/n)
tri[j,2] <- sd(x[(j+1):(n-j)]) / sqrt(n-j*2)
}
return(tri)
}
midrange <- function(x) {
return((max(x)+min(x))/2)
}
q1 <- function(data,n,p,i,f) {
np <- n*p;
i <<- floor(np)
f <<- np - i
qvalue <- (1-f)*data[i] + f*data[i+1]
}
q2 <- function(data,n,p,i,f) {
np <- (n+1)*p
i <<- floor(np)
f <<- np - i
qvalue <- (1-f)*data[i] + f*data[i+1]
}
q3 <- function(data,n,p,i,f) {
np <- n*p
i <<- floor(np)
f <<- np - i
if (f==0) {
qvalue <- data[i]
} else {
qvalue <- data[i+1]
}
}
q4 <- function(data,n,p,i,f) {
np <- n*p
i <<- floor(np)
f <<- np - i
if (f==0) {
qvalue <- (data[i]+data[i+1])/2
} else {
qvalue <- data[i+1]
}
}
q5 <- function(data,n,p,i,f) {
np <- (n-1)*p
i <<- floor(np)
f <<- np - i
if (f==0) {
qvalue <- data[i+1]
} else {
qvalue <- data[i+1] + f*(data[i+2]-data[i+1])
}
}
q6 <- function(data,n,p,i,f) {
np <- n*p+0.5
i <<- floor(np)
f <<- np - i
qvalue <- data[i]
}
q7 <- function(data,n,p,i,f) {
np <- (n+1)*p
i <<- floor(np)
f <<- np - i
if (f==0) {
qvalue <- data[i]
} else {
qvalue <- f*data[i] + (1-f)*data[i+1]
}
}
q8 <- function(data,n,p,i,f) {
np <- (n+1)*p
i <<- floor(np)
f <<- np - i
if (f==0) {
qvalue <- data[i]
} else {
if (f == 0.5) {
qvalue <- (data[i]+data[i+1])/2
} else {
if (f < 0.5) {
qvalue <- data[i]
} else {
qvalue <- data[i+1]
}
}
}
}
midmean <- function(x,def) {
x <-sort(x[!is.na(x)])
n<-length(x)
if (def==1) {
qvalue1 <- q1(x,n,0.25,i,f)
qvalue3 <- q1(x,n,0.75,i,f)
}
if (def==2) {
qvalue1 <- q2(x,n,0.25,i,f)
qvalue3 <- q2(x,n,0.75,i,f)
}
if (def==3) {
qvalue1 <- q3(x,n,0.25,i,f)
qvalue3 <- q3(x,n,0.75,i,f)
}
if (def==4) {
qvalue1 <- q4(x,n,0.25,i,f)
qvalue3 <- q4(x,n,0.75,i,f)
}
if (def==5) {
qvalue1 <- q5(x,n,0.25,i,f)
qvalue3 <- q5(x,n,0.75,i,f)
}
if (def==6) {
qvalue1 <- q6(x,n,0.25,i,f)
qvalue3 <- q6(x,n,0.75,i,f)
}
if (def==7) {
qvalue1 <- q7(x,n,0.25,i,f)
qvalue3 <- q7(x,n,0.75,i,f)
}
if (def==8) {
qvalue1 <- q8(x,n,0.25,i,f)
qvalue3 <- q8(x,n,0.75,i,f)
}
midm <- 0
myn <- 0
roundno4 <- round(n/4)
round3no4 <- round(3*n/4)
for (i in 1:n) {
if ((x[i]>=qvalue1) & (x[i]<=qvalue3)){
midm = midm + x[i]
myn = myn + 1
}
}
midm = midm / myn
return(midm)
}
(arm <- mean(x))
sqrtn <- sqrt(length(x))
(armse <- sd(x) / sqrtn)
(armose <- arm / armse)
(geo <- geomean(x))
(har <- harmean(x))
(qua <- quamean(x))
(win <- winmean(x))
(tri <- trimean(x))
(midr <- midrange(x))
midm <- array(NA,dim=8)
for (j in 1:8) midm[j] <- midmean(x,j)
midm
bitmap(file='test1.png')
lb <- win[,1] - 2*win[,2]
ub <- win[,1] + 2*win[,2]
if ((ylimmin == '') | (ylimmax == '')) plot(win[,1],type='b',main=main, xlab='j', pch=19, ylab='Winsorized Mean(j/n)', ylim=c(min(lb),max(ub))) else plot(win[,1],type='l',main=main, xlab='j', pch=19, ylab='Winsorized Mean(j/n)', ylim=c(ylimmin,ylimmax))
lines(ub,lty=3)
lines(lb,lty=3)
grid()
dev.off()
bitmap(file='test2.png')
lb <- tri[,1] - 2*tri[,2]
ub <- tri[,1] + 2*tri[,2]
if ((ylimmin == '') | (ylimmax == '')) plot(tri[,1],type='b',main=main, xlab='j', pch=19, ylab='Trimmed Mean(j/n)', ylim=c(min(lb),max(ub))) else plot(tri[,1],type='l',main=main, xlab='j', pch=19, ylab='Trimmed Mean(j/n)', ylim=c(ylimmin,ylimmax))
lines(ub,lty=3)
lines(lb,lty=3)
grid()
dev.off()
load(file='createtable')
a<-table.start()
a<-table.row.start(a)
a<-table.element(a,'Central Tendency - Ungrouped Data',4,TRUE)
a<-table.row.end(a)
a<-table.row.start(a)
a<-table.element(a,'Measure',header=TRUE)
a<-table.element(a,'Value',header=TRUE)
a<-table.element(a,'S.E.',header=TRUE)
a<-table.element(a,'Value/S.E.',header=TRUE)
a<-table.row.end(a)
a<-table.row.start(a)
a<-table.element(a,hyperlink('arithmetic_mean.htm', 'Arithmetic Mean', 'click to view the definition of the Arithmetic Mean'),header=TRUE)
a<-table.element(a,arm)
a<-table.element(a,hyperlink('arithmetic_mean_standard_error.htm', armse, 'click to view the definition of the Standard Error of the Arithmetic Mean'))
a<-table.element(a,armose)
a<-table.row.end(a)
a<-table.row.start(a)
a<-table.element(a,hyperlink('geometric_mean.htm', 'Geometric Mean', 'click to view the definition of the Geometric Mean'),header=TRUE)
a<-table.element(a,geo)
a<-table.element(a,'')
a<-table.row.end(a)
a<-table.row.start(a)
a<-table.element(a,hyperlink('harmonic_mean.htm', 'Harmonic Mean', 'click to view the definition of the Harmonic Mean'),header=TRUE)
a<-table.element(a,har)
a<-table.element(a,'')
a<-table.row.end(a)
a<-table.row.start(a)
a<-table.element(a,hyperlink('quadratic_mean.htm', 'Quadratic Mean', 'click to view the definition of the Quadratic Mean'),header=TRUE)
a<-table.element(a,qua)
a<-table.element(a,'')
a<-table.row.end(a)
for (j in 1:length(win[,1])) {
a<-table.row.start(a)
mylabel <- paste('Winsorized Mean (',j)
mylabel <- paste(mylabel,'/')
mylabel <- paste(mylabel,length(win[,1]))
mylabel <- paste(mylabel,')')
a<-table.element(a,hyperlink('winsorized_mean.htm', mylabel, 'click to view the definition of the Winsorized Mean'),header=TRUE)
a<-table.element(a,win[j,1])
a<-table.element(a,win[j,2])
a<-table.element(a,win[j,1]/win[j,2])
a<-table.row.end(a)
}
for (j in 1:length(tri[,1])) {
a<-table.row.start(a)
mylabel <- paste('Trimmed Mean (',j)
mylabel <- paste(mylabel,'/')
mylabel <- paste(mylabel,length(tri[,1]))
mylabel <- paste(mylabel,')')
a<-table.element(a,hyperlink('arithmetic_mean.htm', mylabel, 'click to view the definition of the Trimmed Mean'),header=TRUE)
a<-table.element(a,tri[j,1])
a<-table.element(a,tri[j,2])
a<-table.element(a,tri[j,1]/tri[j,2])
a<-table.row.end(a)
}
a<-table.row.start(a)
a<-table.element(a,hyperlink('median_1.htm', 'Median', 'click to view the definition of the Median'),header=TRUE)
a<-table.element(a,median(x))
a<-table.element(a,'')
a<-table.row.end(a)
a<-table.row.start(a)
a<-table.element(a,hyperlink('midrange.htm', 'Midrange', 'click to view the definition of the Midrange'),header=TRUE)
a<-table.element(a,midr)
a<-table.element(a,'')
a<-table.row.end(a)
a<-table.row.start(a)
mymid <- hyperlink('midmean.htm', 'Midmean', 'click to view the definition of the Midmean')
mylabel <- paste(mymid,hyperlink('method_1.htm','Weighted Average at Xnp',''),sep=' - ')
a<-table.element(a,mylabel,header=TRUE)
a<-table.element(a,midm[1])
a<-table.element(a,'')
a<-table.row.end(a)
a<-table.row.start(a)
mymid <- hyperlink('midmean.htm', 'Midmean', 'click to view the definition of the Midmean')
mylabel <- paste(mymid,hyperlink('method_2.htm','Weighted Average at X(n+1)p',''),sep=' - ')
a<-table.element(a,mylabel,header=TRUE)
a<-table.element(a,midm[2])
a<-table.element(a,'')
a<-table.row.end(a)
a<-table.row.start(a)
mymid <- hyperlink('midmean.htm', 'Midmean', 'click to view the definition of the Midmean')
mylabel <- paste(mymid,hyperlink('method_3.htm','Empirical Distribution Function',''),sep=' - ')
a<-table.element(a,mylabel,header=TRUE)
a<-table.element(a,midm[3])
a<-table.element(a,'')
a<-table.row.end(a)
a<-table.row.start(a)
mymid <- hyperlink('midmean.htm', 'Midmean', 'click to view the definition of the Midmean')
mylabel <- paste(mymid,hyperlink('method_4.htm','Empirical Distribution Function - Averaging',''),sep=' - ')
a<-table.element(a,mylabel,header=TRUE)
a<-table.element(a,midm[4])
a<-table.element(a,'')
a<-table.row.end(a)
a<-table.row.start(a)
mymid <- hyperlink('midmean.htm', 'Midmean', 'click to view the definition of the Midmean')
mylabel <- paste(mymid,hyperlink('method_5.htm','Empirical Distribution Function - Interpolation',''),sep=' - ')
a<-table.element(a,mylabel,header=TRUE)
a<-table.element(a,midm[5])
a<-table.element(a,'')
a<-table.row.end(a)
a<-table.row.start(a)
mymid <- hyperlink('midmean.htm', 'Midmean', 'click to view the definition of the Midmean')
mylabel <- paste(mymid,hyperlink('method_6.htm','Closest Observation',''),sep=' - ')
a<-table.element(a,mylabel,header=TRUE)
a<-table.element(a,midm[6])
a<-table.element(a,'')
a<-table.row.end(a)
a<-table.row.start(a)
mymid <- hyperlink('midmean.htm', 'Midmean', 'click to view the definition of the Midmean')
mylabel <- paste(mymid,hyperlink('method_7.htm','True Basic - Statistics Graphics Toolkit',''),sep=' - ')
a<-table.element(a,mylabel,header=TRUE)
a<-table.element(a,midm[7])
a<-table.element(a,'')
a<-table.row.end(a)
a<-table.row.start(a)
mymid <- hyperlink('midmean.htm', 'Midmean', 'click to view the definition of the Midmean')
mylabel <- paste(mymid,hyperlink('method_8.htm','MS Excel (old versions)',''),sep=' - ')
a<-table.element(a,mylabel,header=TRUE)
a<-table.element(a,midm[8])
a<-table.element(a,'')
a<-table.row.end(a)
a<-table.row.start(a)
a<-table.element(a,'Number of observations',header=TRUE)
a<-table.element(a,length(x))
a<-table.element(a,'')
a<-table.row.end(a)
a<-table.end(a)
table.save(a,file='mytable.tab')