Free Statistics
of Irreproducible Research!
Description of Statistical Computation | |||||||||||||||||||||||||||||||||||||||||||||||||||||||||||||||||||||||||||||||||||||||||||||||||||
|---|---|---|---|---|---|---|---|---|---|---|---|---|---|---|---|---|---|---|---|---|---|---|---|---|---|---|---|---|---|---|---|---|---|---|---|---|---|---|---|---|---|---|---|---|---|---|---|---|---|---|---|---|---|---|---|---|---|---|---|---|---|---|---|---|---|---|---|---|---|---|---|---|---|---|---|---|---|---|---|---|---|---|---|---|---|---|---|---|---|---|---|---|---|---|---|---|---|---|---|
| Author's title | |||||||||||||||||||||||||||||||||||||||||||||||||||||||||||||||||||||||||||||||||||||||||||||||||||
| Author | *The author of this computation has been verified* | ||||||||||||||||||||||||||||||||||||||||||||||||||||||||||||||||||||||||||||||||||||||||||||||||||
| R Software Module | rwasp_correlation.wasp | ||||||||||||||||||||||||||||||||||||||||||||||||||||||||||||||||||||||||||||||||||||||||||||||||||
| Title produced by software | Pearson Correlation | ||||||||||||||||||||||||||||||||||||||||||||||||||||||||||||||||||||||||||||||||||||||||||||||||||
| Date of computation | Thu, 25 Nov 2010 09:36:10 +0000 | ||||||||||||||||||||||||||||||||||||||||||||||||||||||||||||||||||||||||||||||||||||||||||||||||||
| Cite this page as follows | Statistical Computations at FreeStatistics.org, Office for Research Development and Education, URL https://freestatistics.org/blog/index.php?v=date/2010/Nov/25/t1290678147q9gaf790yjbbce5.htm/, Retrieved Fri, 19 Apr 2024 23:50:35 +0000 | ||||||||||||||||||||||||||||||||||||||||||||||||||||||||||||||||||||||||||||||||||||||||||||||||||
| Statistical Computations at FreeStatistics.org, Office for Research Development and Education, URL https://freestatistics.org/blog/index.php?pk=100683, Retrieved Fri, 19 Apr 2024 23:50:35 +0000 | |||||||||||||||||||||||||||||||||||||||||||||||||||||||||||||||||||||||||||||||||||||||||||||||||||
| QR Codes: | |||||||||||||||||||||||||||||||||||||||||||||||||||||||||||||||||||||||||||||||||||||||||||||||||||
|
| |||||||||||||||||||||||||||||||||||||||||||||||||||||||||||||||||||||||||||||||||||||||||||||||||||
| Original text written by user: | |||||||||||||||||||||||||||||||||||||||||||||||||||||||||||||||||||||||||||||||||||||||||||||||||||
| IsPrivate? | No (this computation is public) | ||||||||||||||||||||||||||||||||||||||||||||||||||||||||||||||||||||||||||||||||||||||||||||||||||
| User-defined keywords | |||||||||||||||||||||||||||||||||||||||||||||||||||||||||||||||||||||||||||||||||||||||||||||||||||
| Estimated Impact | 109 | ||||||||||||||||||||||||||||||||||||||||||||||||||||||||||||||||||||||||||||||||||||||||||||||||||
Tree of Dependent Computations | |||||||||||||||||||||||||||||||||||||||||||||||||||||||||||||||||||||||||||||||||||||||||||||||||||
| Family? (F = Feedback message, R = changed R code, M = changed R Module, P = changed Parameters, D = changed Data) | |||||||||||||||||||||||||||||||||||||||||||||||||||||||||||||||||||||||||||||||||||||||||||||||||||
| - [Linear Regression Graphical Model Validation] [Colombia Coffee -...] [2008-02-26 10:22:06] [74be16979710d4c4e7c6647856088456] - RMPD [Pearson Correlation] [correlatiecoëffi...] [2010-11-25 09:36:10] [03bcd8c83ef1a42b4029a16ba47a4880] [Current] - D [Pearson Correlation] [correlatiecoëffi...] [2010-11-25 19:51:28] [96348ef82925ade81ab3c243141d80f1] - RM D [] [Paper (Pearson Co...] [1970-01-01 00:00:00] [845827b7f02503df17c96f445745fee7] - RM D [Pearson Correlation] [Paper (Pearson Co...] [2010-12-27 11:37:20] [845827b7f02503df17c96f445745fee7] | |||||||||||||||||||||||||||||||||||||||||||||||||||||||||||||||||||||||||||||||||||||||||||||||||||
| Feedback Forum | |||||||||||||||||||||||||||||||||||||||||||||||||||||||||||||||||||||||||||||||||||||||||||||||||||
Post a new message | |||||||||||||||||||||||||||||||||||||||||||||||||||||||||||||||||||||||||||||||||||||||||||||||||||
Dataset | |||||||||||||||||||||||||||||||||||||||||||||||||||||||||||||||||||||||||||||||||||||||||||||||||||
| Dataseries X: | |||||||||||||||||||||||||||||||||||||||||||||||||||||||||||||||||||||||||||||||||||||||||||||||||||
2.2 1.4 3.4 2 2.4 2.4 2.2 2.2 2.4 2.6 2.8 3.2 2.2 2 2.2 3 1.8 2.2 3.4 3.4 2.2 3.6 2.8 2 2.2 3 3 2.6 3.2 2.6 1.8 3.6 3.6 2.4 3.4 1.8 1.8 2.4 3.6 2.4 3.6 2.8 3 3.2 2 2.2 2.8 1.8 2.4 3.4 1 2.4 2.4 1.2 4.8 2.4 2.4 2.8 1.4 2.6 2.4 2.6 2.8 1.6 2.2 1.8 2.2 2.6 2 2.2 2.4 1.8 3 3.6 3 2.4 2.6 2.8 2 2.6 2.6 2.2 2.6 3.2 1.6 3.2 2.2 1.8 3.2 2.4 2.8 1.6 1.8 3 2.2 4.2 2.8 3.6 2.4 2.6 3 2.4 3.8 3 2.2 2.2 2 2.6 3 2.4 2.4 3.2 1.8 3.6 1.6 2.6 3.4 1.8 3 1.6 1.4 2.4 2.8 1.2 1.6 3.4 2 2.2 2.8 2.2 2.6 2.4 2.2 1.8 2.4 4 2.4 2.6 2.4 2.4 1.8 3 4.8 1.4 3.4 2.2 3.4 2.2 2.4 2.8 2.2 3.2 4.2 2.8 4 2.6 2.2 3 3.8 | |||||||||||||||||||||||||||||||||||||||||||||||||||||||||||||||||||||||||||||||||||||||||||||||||||
| Dataseries Y: | |||||||||||||||||||||||||||||||||||||||||||||||||||||||||||||||||||||||||||||||||||||||||||||||||||
3.43 3.57 4.29 2.71 3.14 3.14 3.57 3.29 2.43 3.00 2.71 2.71 2.14 2.29 3.29 3.86 3.14 2.00 3.14 3.29 3.29 3.00 2.71 2.57 2.86 3.29 3.57 2.71 3.43 3.14 3.57 3.71 4.14 4.57 3.57 4.14 4.00 2.43 4.00 4.14 3.71 3.57 2.00 3.57 3.71 2.86 2.57 4.57 3.57 3.57 3.29 3.00 2.86 2.14 4.29 3.43 3.71 3.43 3.14 2.00 3.43 3.43 3.43 3.43 2.71 4.43 3.14 3.86 2.71 3.57 2.86 3.00 3.86 3.29 3.57 2.86 3.00 3.14 3.29 3.57 3.57 2.43 2.71 3.57 2.71 2.86 3.71 3.29 3.86 2.43 2.43 2.71 2.43 3.14 3.00 4.57 3.00 3.00 2.57 2.57 3.29 2.71 2.86 3.00 2.86 2.43 2.57 2.71 3.14 2.14 2.00 2.57 3.43 5.00 4.14 3.00 3.57 2.86 3.14 1.86 3.71 2.43 3.57 2.86 2.71 3.00 3.14 3.43 3.00 3.71 3.43 2.29 3.29 2.57 2.29 3.71 2.71 3.00 3.00 3.14 3.29 4.14 3.00 3.00 3.29 3.86 3.57 3.00 1.43 2.86 3.71 3.43 4.14 2.71 3.43 2.71 3.43 3.14 2.43 | |||||||||||||||||||||||||||||||||||||||||||||||||||||||||||||||||||||||||||||||||||||||||||||||||||
Tables (Output of Computation) | |||||||||||||||||||||||||||||||||||||||||||||||||||||||||||||||||||||||||||||||||||||||||||||||||||
| |||||||||||||||||||||||||||||||||||||||||||||||||||||||||||||||||||||||||||||||||||||||||||||||||||
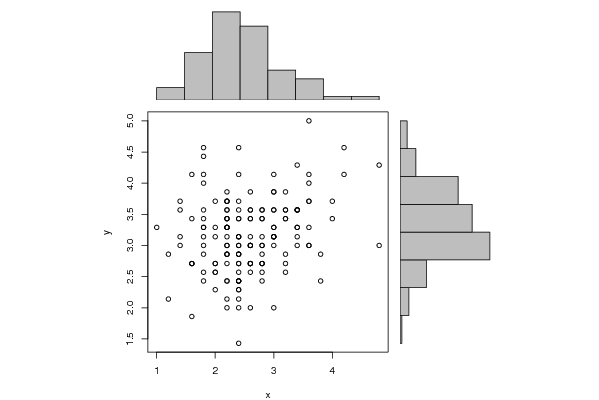
Figures (Output of Computation) | |||||||||||||||||||||||||||||||||||||||||||||||||||||||||||||||||||||||||||||||||||||||||||||||||||
Input Parameters & R Code | |||||||||||||||||||||||||||||||||||||||||||||||||||||||||||||||||||||||||||||||||||||||||||||||||||
| Parameters (Session): | |||||||||||||||||||||||||||||||||||||||||||||||||||||||||||||||||||||||||||||||||||||||||||||||||||
| Parameters (R input): | |||||||||||||||||||||||||||||||||||||||||||||||||||||||||||||||||||||||||||||||||||||||||||||||||||
| R code (references can be found in the software module): | |||||||||||||||||||||||||||||||||||||||||||||||||||||||||||||||||||||||||||||||||||||||||||||||||||
bitmap(file='test1.png') | |||||||||||||||||||||||||||||||||||||||||||||||||||||||||||||||||||||||||||||||||||||||||||||||||||