Free Statistics

of Irreproducible Research!

Author's title

Author*The author of this computation has been verified*
R Software Modulerwasp_centraltendency.wasp
Title produced by softwareCentral Tendency
Date of computationThu, 25 Nov 2010 13:48:08 +0000
Cite this page as followsStatistical Computations at FreeStatistics.org, Office for Research Development and Education, URL https://freestatistics.org/blog/index.php?v=date/2010/Nov/25/t1290693416s405xh7rxk1436y.htm/, Retrieved Sat, 20 Apr 2024 13:58:35 +0000
Statistical Computations at FreeStatistics.org, Office for Research Development and Education, URL https://freestatistics.org/blog/index.php?pk=101012, Retrieved Sat, 20 Apr 2024 13:58:35 +0000
QR Codes:

Original text written by user:gegevens genomen van pagina 3 van de tutorial
IsPrivate?No (this computation is public)
User-defined keywords
Estimated Impact109
Family? (F = Feedback message, R = changed R code, M = changed R Module, P = changed Parameters, D = changed Data)
-     [Central Tendency] [Arabica Price in ...] [2008-01-19 12:03:37] [74be16979710d4c4e7c6647856088456]
- RM D    [Central Tendency] [Tutorial Taak 1 ] [2010-11-25 13:48:08] [fba9c6aa004af59d8497d682e70ddad5] [Current]
Feedback Forum

Post a new message
Dataseries X:
255
280,2
299,9
339,2
374,2
393,5
389,2
381,7
375,2
369
357,4
352,1
346,5
342,9
340,3
328,3
322,9
314,3
308,9
294
285,6
281,2
280,3
278,8
274,5
270,4
263,4
259,9
258
262,7
284,7
311,3
322,1
327
331,3
333,3
321,4
327
320
314,7
316,7
314,4
321,3
318,2
307,2
301,3
287,5
277,7
274,4


Summary of computational transaction
Raw Inputview raw input (R code)
Raw Outputview raw output of R engine
Computing time1 seconds
R Server'George Udny Yule' @ 72.249.76.132

\begin{tabular}{lllllllll}
\hline
Summary of computational transaction \tabularnewline
Raw Input & view raw input (R code)  \tabularnewline
Raw Output & view raw output of R engine  \tabularnewline
Computing time & 1 seconds \tabularnewline
R Server & 'George Udny Yule' @ 72.249.76.132 \tabularnewline
\hline
\end{tabular}
%Source: https://freestatistics.org/blog/index.php?pk=101012&T=0

[TABLE]
[ROW][C]Summary of computational transaction[/C][/ROW]
[ROW][C]Raw Input[/C][C]view raw input (R code) [/C][/ROW]
[ROW][C]Raw Output[/C][C]view raw output of R engine [/C][/ROW]
[ROW][C]Computing time[/C][C]1 seconds[/C][/ROW]
[ROW][C]R Server[/C][C]'George Udny Yule' @ 72.249.76.132[/C][/ROW]
[/TABLE]
Source: https://freestatistics.org/blog/index.php?pk=101012&T=0

Globally Unique Identifier (entire table): ba.freestatistics.org/blog/index.php?pk=101012&T=0

As an alternative you can also use a QR Code:  

The GUIDs for individual cells are displayed in the table below:

Summary of computational transaction
Raw Inputview raw input (R code)
Raw Outputview raw output of R engine
Computing time1 seconds
R Server'George Udny Yule' @ 72.249.76.132


Central Tendency - Ungrouped Data
MeasureValueS.E.Value/S.E.
Arithmetic Mean314.1020408163275.2130457509661260.2530758066174
Geometric Mean312.055749049515
Harmonic Mean310.042760884871
Quadratic Mean316.171682244095
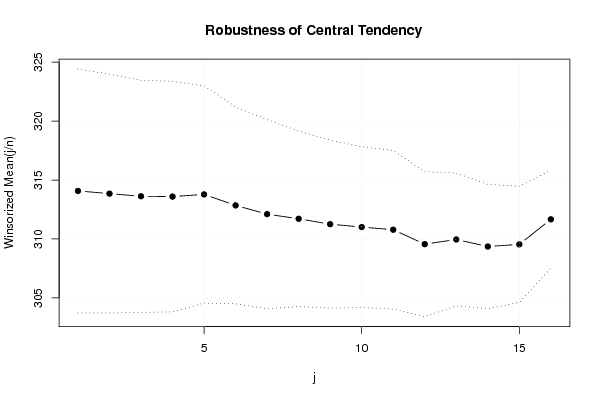
Winsorized Mean ( 1 / 16 )314.0755102040825.1716953780590660.7297002713169
Winsorized Mean ( 2 / 16 )313.846938775515.0652570614912161.9607129441746
Winsorized Mean ( 3 / 16 )313.6204081632654.9202845961116263.7402983581705
Winsorized Mean ( 4 / 16 )313.5959183673474.8868219288702464.1717506657432
Winsorized Mean ( 5 / 16 )313.7795918367354.6052321430919668.1354559525121
Winsorized Mean ( 6 / 16 )312.8489795918374.1738181373837974.9551056836259
Winsorized Mean ( 7 / 16 )312.1061224489804.008057794031977.8696661793933
Winsorized Mean ( 8 / 16 )311.7142857142863.7229843197222883.7269939771163
Winsorized Mean ( 9 / 16 )311.2551020408163.558892356665387.4584198810846
Winsorized Mean ( 10 / 16 )311.0102040816333.4081575369620791.2546443961795
Winsorized Mean ( 11 / 16 )310.7857142857143.3600607886467492.4940749095444
Winsorized Mean ( 12 / 16 )309.5612244897963.07406561259381100.700916474127
Winsorized Mean ( 13 / 16 )309.9591836734692.81322786253177110.179195863118
Winsorized Mean ( 14 / 16 )309.3591836734692.63293329600636117.496020177460
Winsorized Mean ( 15 / 16 )309.5428571428572.46486708118129125.581967281785
Winsorized Mean ( 16 / 16 )311.6653061224492.07840481867936149.954091388454
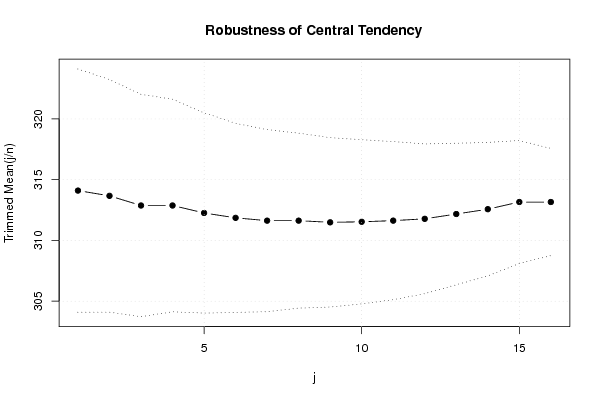
Trimmed Mean ( 1 / 16 )314.1020408163275.0028547954616762.7845607474484
Trimmed Mean ( 2 / 16 )313.6702127659574.7831275662871465.578475258907
Trimmed Mean ( 3 / 16 )312.8767441860464.5726240581871268.423894071469
Trimmed Mean ( 4 / 16 )312.8767441860464.3725839593832971.5541993229502
Trimmed Mean ( 5 / 16 )312.2615384615384.1183825018617775.8214027765455
Trimmed Mean ( 6 / 16 )311.8594594594593.8902636212646180.1640942158268
Trimmed Mean ( 7 / 16 )311.6285714285713.7438657310652783.237112069161
Trimmed Mean ( 8 / 16 )311.6285714285713.5969875672885886.6359879201578
Trimmed Mean ( 9 / 16 )311.4903225806453.4850598329931489.378758904441
Trimmed Mean ( 10 / 16 )311.5344827586213.373353551555992.3515658816524
Trimmed Mean ( 11 / 16 )311.6296296296303.2534479401087095.784421747722
Trimmed Mean ( 12 / 16 )311.783.07906371050249101.258054172942
Trimmed Mean ( 13 / 16 )312.1739130434782.91057915940016107.254912492335
Trimmed Mean ( 14 / 16 )312.5714285714292.74409446298204113.906949191448
Trimmed Mean ( 15 / 16 )313.1631578947372.52538238117113124.006233760730
Trimmed Mean ( 16 / 16 )313.1631578947372.20530874895120142.004224144883
Median314.7
Midrange324.25
Midmean - Weighted Average at Xnp310.883333333333
Midmean - Weighted Average at X(n+1)p311.78
Midmean - Empirical Distribution Function311.78
Midmean - Empirical Distribution Function - Averaging311.78
Midmean - Empirical Distribution Function - Interpolation311.78
Midmean - Closest Observation310.569230769231
Midmean - True Basic - Statistics Graphics Toolkit311.78
Midmean - MS Excel (old versions)311.78
Number of observations49

\begin{tabular}{lllllllll}
\hline
Central Tendency - Ungrouped Data \tabularnewline
Measure & Value & S.E. & Value/S.E. \tabularnewline
Arithmetic Mean & 314.102040816327 & 5.21304575096612 & 60.2530758066174 \tabularnewline
Geometric Mean & 312.055749049515 &  &  \tabularnewline
Harmonic Mean & 310.042760884871 &  &  \tabularnewline
Quadratic Mean & 316.171682244095 &  &  \tabularnewline
Winsorized Mean ( 1 / 16 ) & 314.075510204082 & 5.17169537805906 & 60.7297002713169 \tabularnewline
Winsorized Mean ( 2 / 16 ) & 313.84693877551 & 5.06525706149121 & 61.9607129441746 \tabularnewline
Winsorized Mean ( 3 / 16 ) & 313.620408163265 & 4.92028459611162 & 63.7402983581705 \tabularnewline
Winsorized Mean ( 4 / 16 ) & 313.595918367347 & 4.88682192887024 & 64.1717506657432 \tabularnewline
Winsorized Mean ( 5 / 16 ) & 313.779591836735 & 4.60523214309196 & 68.1354559525121 \tabularnewline
Winsorized Mean ( 6 / 16 ) & 312.848979591837 & 4.17381813738379 & 74.9551056836259 \tabularnewline
Winsorized Mean ( 7 / 16 ) & 312.106122448980 & 4.0080577940319 & 77.8696661793933 \tabularnewline
Winsorized Mean ( 8 / 16 ) & 311.714285714286 & 3.72298431972228 & 83.7269939771163 \tabularnewline
Winsorized Mean ( 9 / 16 ) & 311.255102040816 & 3.5588923566653 & 87.4584198810846 \tabularnewline
Winsorized Mean ( 10 / 16 ) & 311.010204081633 & 3.40815753696207 & 91.2546443961795 \tabularnewline
Winsorized Mean ( 11 / 16 ) & 310.785714285714 & 3.36006078864674 & 92.4940749095444 \tabularnewline
Winsorized Mean ( 12 / 16 ) & 309.561224489796 & 3.07406561259381 & 100.700916474127 \tabularnewline
Winsorized Mean ( 13 / 16 ) & 309.959183673469 & 2.81322786253177 & 110.179195863118 \tabularnewline
Winsorized Mean ( 14 / 16 ) & 309.359183673469 & 2.63293329600636 & 117.496020177460 \tabularnewline
Winsorized Mean ( 15 / 16 ) & 309.542857142857 & 2.46486708118129 & 125.581967281785 \tabularnewline
Winsorized Mean ( 16 / 16 ) & 311.665306122449 & 2.07840481867936 & 149.954091388454 \tabularnewline
Trimmed Mean ( 1 / 16 ) & 314.102040816327 & 5.00285479546167 & 62.7845607474484 \tabularnewline
Trimmed Mean ( 2 / 16 ) & 313.670212765957 & 4.78312756628714 & 65.578475258907 \tabularnewline
Trimmed Mean ( 3 / 16 ) & 312.876744186046 & 4.57262405818712 & 68.423894071469 \tabularnewline
Trimmed Mean ( 4 / 16 ) & 312.876744186046 & 4.37258395938329 & 71.5541993229502 \tabularnewline
Trimmed Mean ( 5 / 16 ) & 312.261538461538 & 4.11838250186177 & 75.8214027765455 \tabularnewline
Trimmed Mean ( 6 / 16 ) & 311.859459459459 & 3.89026362126461 & 80.1640942158268 \tabularnewline
Trimmed Mean ( 7 / 16 ) & 311.628571428571 & 3.74386573106527 & 83.237112069161 \tabularnewline
Trimmed Mean ( 8 / 16 ) & 311.628571428571 & 3.59698756728858 & 86.6359879201578 \tabularnewline
Trimmed Mean ( 9 / 16 ) & 311.490322580645 & 3.48505983299314 & 89.378758904441 \tabularnewline
Trimmed Mean ( 10 / 16 ) & 311.534482758621 & 3.3733535515559 & 92.3515658816524 \tabularnewline
Trimmed Mean ( 11 / 16 ) & 311.629629629630 & 3.25344794010870 & 95.784421747722 \tabularnewline
Trimmed Mean ( 12 / 16 ) & 311.78 & 3.07906371050249 & 101.258054172942 \tabularnewline
Trimmed Mean ( 13 / 16 ) & 312.173913043478 & 2.91057915940016 & 107.254912492335 \tabularnewline
Trimmed Mean ( 14 / 16 ) & 312.571428571429 & 2.74409446298204 & 113.906949191448 \tabularnewline
Trimmed Mean ( 15 / 16 ) & 313.163157894737 & 2.52538238117113 & 124.006233760730 \tabularnewline
Trimmed Mean ( 16 / 16 ) & 313.163157894737 & 2.20530874895120 & 142.004224144883 \tabularnewline
Median & 314.7 &  &  \tabularnewline
Midrange & 324.25 &  &  \tabularnewline
Midmean - Weighted Average at Xnp & 310.883333333333 &  &  \tabularnewline
Midmean - Weighted Average at X(n+1)p & 311.78 &  &  \tabularnewline
Midmean - Empirical Distribution Function & 311.78 &  &  \tabularnewline
Midmean - Empirical Distribution Function - Averaging & 311.78 &  &  \tabularnewline
Midmean - Empirical Distribution Function - Interpolation & 311.78 &  &  \tabularnewline
Midmean - Closest Observation & 310.569230769231 &  &  \tabularnewline
Midmean - True Basic - Statistics Graphics Toolkit & 311.78 &  &  \tabularnewline
Midmean - MS Excel (old versions) & 311.78 &  &  \tabularnewline
Number of observations & 49 &  &  \tabularnewline
\hline
\end{tabular}
%Source: https://freestatistics.org/blog/index.php?pk=101012&T=1

[TABLE]
[ROW][C]Central Tendency - Ungrouped Data[/C][/ROW]
[ROW][C]Measure[/C][C]Value[/C][C]S.E.[/C][C]Value/S.E.[/C][/ROW]
[ROW][C]Arithmetic Mean[/C][C]314.102040816327[/C][C]5.21304575096612[/C][C]60.2530758066174[/C][/ROW]
[ROW][C]Geometric Mean[/C][C]312.055749049515[/C][C][/C][C][/C][/ROW]
[ROW][C]Harmonic Mean[/C][C]310.042760884871[/C][C][/C][C][/C][/ROW]
[ROW][C]Quadratic Mean[/C][C]316.171682244095[/C][C][/C][C][/C][/ROW]
[ROW][C]Winsorized Mean ( 1 / 16 )[/C][C]314.075510204082[/C][C]5.17169537805906[/C][C]60.7297002713169[/C][/ROW]
[ROW][C]Winsorized Mean ( 2 / 16 )[/C][C]313.84693877551[/C][C]5.06525706149121[/C][C]61.9607129441746[/C][/ROW]
[ROW][C]Winsorized Mean ( 3 / 16 )[/C][C]313.620408163265[/C][C]4.92028459611162[/C][C]63.7402983581705[/C][/ROW]
[ROW][C]Winsorized Mean ( 4 / 16 )[/C][C]313.595918367347[/C][C]4.88682192887024[/C][C]64.1717506657432[/C][/ROW]
[ROW][C]Winsorized Mean ( 5 / 16 )[/C][C]313.779591836735[/C][C]4.60523214309196[/C][C]68.1354559525121[/C][/ROW]
[ROW][C]Winsorized Mean ( 6 / 16 )[/C][C]312.848979591837[/C][C]4.17381813738379[/C][C]74.9551056836259[/C][/ROW]
[ROW][C]Winsorized Mean ( 7 / 16 )[/C][C]312.106122448980[/C][C]4.0080577940319[/C][C]77.8696661793933[/C][/ROW]
[ROW][C]Winsorized Mean ( 8 / 16 )[/C][C]311.714285714286[/C][C]3.72298431972228[/C][C]83.7269939771163[/C][/ROW]
[ROW][C]Winsorized Mean ( 9 / 16 )[/C][C]311.255102040816[/C][C]3.5588923566653[/C][C]87.4584198810846[/C][/ROW]
[ROW][C]Winsorized Mean ( 10 / 16 )[/C][C]311.010204081633[/C][C]3.40815753696207[/C][C]91.2546443961795[/C][/ROW]
[ROW][C]Winsorized Mean ( 11 / 16 )[/C][C]310.785714285714[/C][C]3.36006078864674[/C][C]92.4940749095444[/C][/ROW]
[ROW][C]Winsorized Mean ( 12 / 16 )[/C][C]309.561224489796[/C][C]3.07406561259381[/C][C]100.700916474127[/C][/ROW]
[ROW][C]Winsorized Mean ( 13 / 16 )[/C][C]309.959183673469[/C][C]2.81322786253177[/C][C]110.179195863118[/C][/ROW]
[ROW][C]Winsorized Mean ( 14 / 16 )[/C][C]309.359183673469[/C][C]2.63293329600636[/C][C]117.496020177460[/C][/ROW]
[ROW][C]Winsorized Mean ( 15 / 16 )[/C][C]309.542857142857[/C][C]2.46486708118129[/C][C]125.581967281785[/C][/ROW]
[ROW][C]Winsorized Mean ( 16 / 16 )[/C][C]311.665306122449[/C][C]2.07840481867936[/C][C]149.954091388454[/C][/ROW]
[ROW][C]Trimmed Mean ( 1 / 16 )[/C][C]314.102040816327[/C][C]5.00285479546167[/C][C]62.7845607474484[/C][/ROW]
[ROW][C]Trimmed Mean ( 2 / 16 )[/C][C]313.670212765957[/C][C]4.78312756628714[/C][C]65.578475258907[/C][/ROW]
[ROW][C]Trimmed Mean ( 3 / 16 )[/C][C]312.876744186046[/C][C]4.57262405818712[/C][C]68.423894071469[/C][/ROW]
[ROW][C]Trimmed Mean ( 4 / 16 )[/C][C]312.876744186046[/C][C]4.37258395938329[/C][C]71.5541993229502[/C][/ROW]
[ROW][C]Trimmed Mean ( 5 / 16 )[/C][C]312.261538461538[/C][C]4.11838250186177[/C][C]75.8214027765455[/C][/ROW]
[ROW][C]Trimmed Mean ( 6 / 16 )[/C][C]311.859459459459[/C][C]3.89026362126461[/C][C]80.1640942158268[/C][/ROW]
[ROW][C]Trimmed Mean ( 7 / 16 )[/C][C]311.628571428571[/C][C]3.74386573106527[/C][C]83.237112069161[/C][/ROW]
[ROW][C]Trimmed Mean ( 8 / 16 )[/C][C]311.628571428571[/C][C]3.59698756728858[/C][C]86.6359879201578[/C][/ROW]
[ROW][C]Trimmed Mean ( 9 / 16 )[/C][C]311.490322580645[/C][C]3.48505983299314[/C][C]89.378758904441[/C][/ROW]
[ROW][C]Trimmed Mean ( 10 / 16 )[/C][C]311.534482758621[/C][C]3.3733535515559[/C][C]92.3515658816524[/C][/ROW]
[ROW][C]Trimmed Mean ( 11 / 16 )[/C][C]311.629629629630[/C][C]3.25344794010870[/C][C]95.784421747722[/C][/ROW]
[ROW][C]Trimmed Mean ( 12 / 16 )[/C][C]311.78[/C][C]3.07906371050249[/C][C]101.258054172942[/C][/ROW]
[ROW][C]Trimmed Mean ( 13 / 16 )[/C][C]312.173913043478[/C][C]2.91057915940016[/C][C]107.254912492335[/C][/ROW]
[ROW][C]Trimmed Mean ( 14 / 16 )[/C][C]312.571428571429[/C][C]2.74409446298204[/C][C]113.906949191448[/C][/ROW]
[ROW][C]Trimmed Mean ( 15 / 16 )[/C][C]313.163157894737[/C][C]2.52538238117113[/C][C]124.006233760730[/C][/ROW]
[ROW][C]Trimmed Mean ( 16 / 16 )[/C][C]313.163157894737[/C][C]2.20530874895120[/C][C]142.004224144883[/C][/ROW]
[ROW][C]Median[/C][C]314.7[/C][C][/C][C][/C][/ROW]
[ROW][C]Midrange[/C][C]324.25[/C][C][/C][C][/C][/ROW]
[ROW][C]Midmean - Weighted Average at Xnp[/C][C]310.883333333333[/C][C][/C][C][/C][/ROW]
[ROW][C]Midmean - Weighted Average at X(n+1)p[/C][C]311.78[/C][C][/C][C][/C][/ROW]
[ROW][C]Midmean - Empirical Distribution Function[/C][C]311.78[/C][C][/C][C][/C][/ROW]
[ROW][C]Midmean - Empirical Distribution Function - Averaging[/C][C]311.78[/C][C][/C][C][/C][/ROW]
[ROW][C]Midmean - Empirical Distribution Function - Interpolation[/C][C]311.78[/C][C][/C][C][/C][/ROW]
[ROW][C]Midmean - Closest Observation[/C][C]310.569230769231[/C][C][/C][C][/C][/ROW]
[ROW][C]Midmean - True Basic - Statistics Graphics Toolkit[/C][C]311.78[/C][C][/C][C][/C][/ROW]
[ROW][C]Midmean - MS Excel (old versions)[/C][C]311.78[/C][C][/C][C][/C][/ROW]
[ROW][C]Number of observations[/C][C]49[/C][C][/C][C][/C][/ROW]
[/TABLE]
Source: https://freestatistics.org/blog/index.php?pk=101012&T=1

Globally Unique Identifier (entire table): ba.freestatistics.org/blog/index.php?pk=101012&T=1

As an alternative you can also use a QR Code:  

The GUIDs for individual cells are displayed in the table below:

Central Tendency - Ungrouped Data
MeasureValueS.E.Value/S.E.
Arithmetic Mean314.1020408163275.2130457509661260.2530758066174
Geometric Mean312.055749049515
Harmonic Mean310.042760884871
Quadratic Mean316.171682244095
Winsorized Mean ( 1 / 16 )314.0755102040825.1716953780590660.7297002713169
Winsorized Mean ( 2 / 16 )313.846938775515.0652570614912161.9607129441746
Winsorized Mean ( 3 / 16 )313.6204081632654.9202845961116263.7402983581705
Winsorized Mean ( 4 / 16 )313.5959183673474.8868219288702464.1717506657432
Winsorized Mean ( 5 / 16 )313.7795918367354.6052321430919668.1354559525121
Winsorized Mean ( 6 / 16 )312.8489795918374.1738181373837974.9551056836259
Winsorized Mean ( 7 / 16 )312.1061224489804.008057794031977.8696661793933
Winsorized Mean ( 8 / 16 )311.7142857142863.7229843197222883.7269939771163
Winsorized Mean ( 9 / 16 )311.2551020408163.558892356665387.4584198810846
Winsorized Mean ( 10 / 16 )311.0102040816333.4081575369620791.2546443961795
Winsorized Mean ( 11 / 16 )310.7857142857143.3600607886467492.4940749095444
Winsorized Mean ( 12 / 16 )309.5612244897963.07406561259381100.700916474127
Winsorized Mean ( 13 / 16 )309.9591836734692.81322786253177110.179195863118
Winsorized Mean ( 14 / 16 )309.3591836734692.63293329600636117.496020177460
Winsorized Mean ( 15 / 16 )309.5428571428572.46486708118129125.581967281785
Winsorized Mean ( 16 / 16 )311.6653061224492.07840481867936149.954091388454
Trimmed Mean ( 1 / 16 )314.1020408163275.0028547954616762.7845607474484
Trimmed Mean ( 2 / 16 )313.6702127659574.7831275662871465.578475258907
Trimmed Mean ( 3 / 16 )312.8767441860464.5726240581871268.423894071469
Trimmed Mean ( 4 / 16 )312.8767441860464.3725839593832971.5541993229502
Trimmed Mean ( 5 / 16 )312.2615384615384.1183825018617775.8214027765455
Trimmed Mean ( 6 / 16 )311.8594594594593.8902636212646180.1640942158268
Trimmed Mean ( 7 / 16 )311.6285714285713.7438657310652783.237112069161
Trimmed Mean ( 8 / 16 )311.6285714285713.5969875672885886.6359879201578
Trimmed Mean ( 9 / 16 )311.4903225806453.4850598329931489.378758904441
Trimmed Mean ( 10 / 16 )311.5344827586213.373353551555992.3515658816524
Trimmed Mean ( 11 / 16 )311.6296296296303.2534479401087095.784421747722
Trimmed Mean ( 12 / 16 )311.783.07906371050249101.258054172942
Trimmed Mean ( 13 / 16 )312.1739130434782.91057915940016107.254912492335
Trimmed Mean ( 14 / 16 )312.5714285714292.74409446298204113.906949191448
Trimmed Mean ( 15 / 16 )313.1631578947372.52538238117113124.006233760730
Trimmed Mean ( 16 / 16 )313.1631578947372.20530874895120142.004224144883
Median314.7
Midrange324.25
Midmean - Weighted Average at Xnp310.883333333333
Midmean - Weighted Average at X(n+1)p311.78
Midmean - Empirical Distribution Function311.78
Midmean - Empirical Distribution Function - Averaging311.78
Midmean - Empirical Distribution Function - Interpolation311.78
Midmean - Closest Observation310.569230769231
Midmean - True Basic - Statistics Graphics Toolkit311.78
Midmean - MS Excel (old versions)311.78
Number of observations49


Parameters (Session):
Parameters (R input):
R code (references can be found in the software module):
geomean <- function(x) {
return(exp(mean(log(x))))
}
harmean <- function(x) {
return(1/mean(1/x))
}
quamean <- function(x) {
return(sqrt(mean(x*x)))
}
winmean <- function(x) {
x <-sort(x[!is.na(x)])
n<-length(x)
denom <- 3
nodenom <- n/denom
if (nodenom>40) denom <- n/40
sqrtn = sqrt(n)
roundnodenom = floor(nodenom)
win <- array(NA,dim=c(roundnodenom,2))
for (j in 1:roundnodenom) {
win[j,1] <- (j*x[j+1]+sum(x[(j+1):(n-j)])+j*x[n-j])/n
win[j,2] <- sd(c(rep(x[j+1],j),x[(j+1):(n-j)],rep(x[n-j],j)))/sqrtn
}
return(win)
}
trimean <- function(x) {
x <-sort(x[!is.na(x)])
n<-length(x)
denom <- 3
nodenom <- n/denom
if (nodenom>40) denom <- n/40
sqrtn = sqrt(n)
roundnodenom = floor(nodenom)
tri <- array(NA,dim=c(roundnodenom,2))
for (j in 1:roundnodenom) {
tri[j,1] <- mean(x,trim=j/n)
tri[j,2] <- sd(x[(j+1):(n-j)]) / sqrt(n-j*2)
}
return(tri)
}
midrange <- function(x) {
return((max(x)+min(x))/2)
}
q1 <- function(data,n,p,i,f) {
np <- n*p;
i <<- floor(np)
f <<- np - i
qvalue <- (1-f)*data[i] + f*data[i+1]
}
q2 <- function(data,n,p,i,f) {
np <- (n+1)*p
i <<- floor(np)
f <<- np - i
qvalue <- (1-f)*data[i] + f*data[i+1]
}
q3 <- function(data,n,p,i,f) {
np <- n*p
i <<- floor(np)
f <<- np - i
if (f==0) {
qvalue <- data[i]
} else {
qvalue <- data[i+1]
}
}
q4 <- function(data,n,p,i,f) {
np <- n*p
i <<- floor(np)
f <<- np - i
if (f==0) {
qvalue <- (data[i]+data[i+1])/2
} else {
qvalue <- data[i+1]
}
}
q5 <- function(data,n,p,i,f) {
np <- (n-1)*p
i <<- floor(np)
f <<- np - i
if (f==0) {
qvalue <- data[i+1]
} else {
qvalue <- data[i+1] + f*(data[i+2]-data[i+1])
}
}
q6 <- function(data,n,p,i,f) {
np <- n*p+0.5
i <<- floor(np)
f <<- np - i
qvalue <- data[i]
}
q7 <- function(data,n,p,i,f) {
np <- (n+1)*p
i <<- floor(np)
f <<- np - i
if (f==0) {
qvalue <- data[i]
} else {
qvalue <- f*data[i] + (1-f)*data[i+1]
}
}
q8 <- function(data,n,p,i,f) {
np <- (n+1)*p
i <<- floor(np)
f <<- np - i
if (f==0) {
qvalue <- data[i]
} else {
if (f == 0.5) {
qvalue <- (data[i]+data[i+1])/2
} else {
if (f < 0.5) {
qvalue <- data[i]
} else {
qvalue <- data[i+1]
}
}
}
}
midmean <- function(x,def) {
x <-sort(x[!is.na(x)])
n<-length(x)
if (def==1) {
qvalue1 <- q1(x,n,0.25,i,f)
qvalue3 <- q1(x,n,0.75,i,f)
}
if (def==2) {
qvalue1 <- q2(x,n,0.25,i,f)
qvalue3 <- q2(x,n,0.75,i,f)
}
if (def==3) {
qvalue1 <- q3(x,n,0.25,i,f)
qvalue3 <- q3(x,n,0.75,i,f)
}
if (def==4) {
qvalue1 <- q4(x,n,0.25,i,f)
qvalue3 <- q4(x,n,0.75,i,f)
}
if (def==5) {
qvalue1 <- q5(x,n,0.25,i,f)
qvalue3 <- q5(x,n,0.75,i,f)
}
if (def==6) {
qvalue1 <- q6(x,n,0.25,i,f)
qvalue3 <- q6(x,n,0.75,i,f)
}
if (def==7) {
qvalue1 <- q7(x,n,0.25,i,f)
qvalue3 <- q7(x,n,0.75,i,f)
}
if (def==8) {
qvalue1 <- q8(x,n,0.25,i,f)
qvalue3 <- q8(x,n,0.75,i,f)
}
midm <- 0
myn <- 0
roundno4 <- round(n/4)
round3no4 <- round(3*n/4)
for (i in 1:n) {
if ((x[i]>=qvalue1) & (x[i]<=qvalue3)){
midm = midm + x[i]
myn = myn + 1
}
}
midm = midm / myn
return(midm)
}
(arm <- mean(x))
sqrtn <- sqrt(length(x))
(armse <- sd(x) / sqrtn)
(armose <- arm / armse)
(geo <- geomean(x))
(har <- harmean(x))
(qua <- quamean(x))
(win <- winmean(x))
(tri <- trimean(x))
(midr <- midrange(x))
midm <- array(NA,dim=8)
for (j in 1:8) midm[j] <- midmean(x,j)
midm
bitmap(file='test1.png')
lb <- win[,1] - 2*win[,2]
ub <- win[,1] + 2*win[,2]
if ((ylimmin == '') | (ylimmax == '')) plot(win[,1],type='b',main=main, xlab='j', pch=19, ylab='Winsorized Mean(j/n)', ylim=c(min(lb),max(ub))) else plot(win[,1],type='l',main=main, xlab='j', pch=19, ylab='Winsorized Mean(j/n)', ylim=c(ylimmin,ylimmax))
lines(ub,lty=3)
lines(lb,lty=3)
grid()
dev.off()
bitmap(file='test2.png')
lb <- tri[,1] - 2*tri[,2]
ub <- tri[,1] + 2*tri[,2]
if ((ylimmin == '') | (ylimmax == '')) plot(tri[,1],type='b',main=main, xlab='j', pch=19, ylab='Trimmed Mean(j/n)', ylim=c(min(lb),max(ub))) else plot(tri[,1],type='l',main=main, xlab='j', pch=19, ylab='Trimmed Mean(j/n)', ylim=c(ylimmin,ylimmax))
lines(ub,lty=3)
lines(lb,lty=3)
grid()
dev.off()
load(file='createtable')
a<-table.start()
a<-table.row.start(a)
a<-table.element(a,'Central Tendency - Ungrouped Data',4,TRUE)
a<-table.row.end(a)
a<-table.row.start(a)
a<-table.element(a,'Measure',header=TRUE)
a<-table.element(a,'Value',header=TRUE)
a<-table.element(a,'S.E.',header=TRUE)
a<-table.element(a,'Value/S.E.',header=TRUE)
a<-table.row.end(a)
a<-table.row.start(a)
a<-table.element(a,hyperlink('arithmetic_mean.htm', 'Arithmetic Mean', 'click to view the definition of the Arithmetic Mean'),header=TRUE)
a<-table.element(a,arm)
a<-table.element(a,hyperlink('arithmetic_mean_standard_error.htm', armse, 'click to view the definition of the Standard Error of the Arithmetic Mean'))
a<-table.element(a,armose)
a<-table.row.end(a)
a<-table.row.start(a)
a<-table.element(a,hyperlink('geometric_mean.htm', 'Geometric Mean', 'click to view the definition of the Geometric Mean'),header=TRUE)
a<-table.element(a,geo)
a<-table.element(a,'')
a<-table.row.end(a)
a<-table.row.start(a)
a<-table.element(a,hyperlink('harmonic_mean.htm', 'Harmonic Mean', 'click to view the definition of the Harmonic Mean'),header=TRUE)
a<-table.element(a,har)
a<-table.element(a,'')
a<-table.row.end(a)
a<-table.row.start(a)
a<-table.element(a,hyperlink('quadratic_mean.htm', 'Quadratic Mean', 'click to view the definition of the Quadratic Mean'),header=TRUE)
a<-table.element(a,qua)
a<-table.element(a,'')
a<-table.row.end(a)
for (j in 1:length(win[,1])) {
a<-table.row.start(a)
mylabel <- paste('Winsorized Mean (',j)
mylabel <- paste(mylabel,'/')
mylabel <- paste(mylabel,length(win[,1]))
mylabel <- paste(mylabel,')')
a<-table.element(a,hyperlink('winsorized_mean.htm', mylabel, 'click to view the definition of the Winsorized Mean'),header=TRUE)
a<-table.element(a,win[j,1])
a<-table.element(a,win[j,2])
a<-table.element(a,win[j,1]/win[j,2])
a<-table.row.end(a)
}
for (j in 1:length(tri[,1])) {
a<-table.row.start(a)
mylabel <- paste('Trimmed Mean (',j)
mylabel <- paste(mylabel,'/')
mylabel <- paste(mylabel,length(tri[,1]))
mylabel <- paste(mylabel,')')
a<-table.element(a,hyperlink('arithmetic_mean.htm', mylabel, 'click to view the definition of the Trimmed Mean'),header=TRUE)
a<-table.element(a,tri[j,1])
a<-table.element(a,tri[j,2])
a<-table.element(a,tri[j,1]/tri[j,2])
a<-table.row.end(a)
}
a<-table.row.start(a)
a<-table.element(a,hyperlink('median_1.htm', 'Median', 'click to view the definition of the Median'),header=TRUE)
a<-table.element(a,median(x))
a<-table.element(a,'')
a<-table.row.end(a)
a<-table.row.start(a)
a<-table.element(a,hyperlink('midrange.htm', 'Midrange', 'click to view the definition of the Midrange'),header=TRUE)
a<-table.element(a,midr)
a<-table.element(a,'')
a<-table.row.end(a)
a<-table.row.start(a)
mymid <- hyperlink('midmean.htm', 'Midmean', 'click to view the definition of the Midmean')
mylabel <- paste(mymid,hyperlink('method_1.htm','Weighted Average at Xnp',''),sep=' - ')
a<-table.element(a,mylabel,header=TRUE)
a<-table.element(a,midm[1])
a<-table.element(a,'')
a<-table.row.end(a)
a<-table.row.start(a)
mymid <- hyperlink('midmean.htm', 'Midmean', 'click to view the definition of the Midmean')
mylabel <- paste(mymid,hyperlink('method_2.htm','Weighted Average at X(n+1)p',''),sep=' - ')
a<-table.element(a,mylabel,header=TRUE)
a<-table.element(a,midm[2])
a<-table.element(a,'')
a<-table.row.end(a)
a<-table.row.start(a)
mymid <- hyperlink('midmean.htm', 'Midmean', 'click to view the definition of the Midmean')
mylabel <- paste(mymid,hyperlink('method_3.htm','Empirical Distribution Function',''),sep=' - ')
a<-table.element(a,mylabel,header=TRUE)
a<-table.element(a,midm[3])
a<-table.element(a,'')
a<-table.row.end(a)
a<-table.row.start(a)
mymid <- hyperlink('midmean.htm', 'Midmean', 'click to view the definition of the Midmean')
mylabel <- paste(mymid,hyperlink('method_4.htm','Empirical Distribution Function - Averaging',''),sep=' - ')
a<-table.element(a,mylabel,header=TRUE)
a<-table.element(a,midm[4])
a<-table.element(a,'')
a<-table.row.end(a)
a<-table.row.start(a)
mymid <- hyperlink('midmean.htm', 'Midmean', 'click to view the definition of the Midmean')
mylabel <- paste(mymid,hyperlink('method_5.htm','Empirical Distribution Function - Interpolation',''),sep=' - ')
a<-table.element(a,mylabel,header=TRUE)
a<-table.element(a,midm[5])
a<-table.element(a,'')
a<-table.row.end(a)
a<-table.row.start(a)
mymid <- hyperlink('midmean.htm', 'Midmean', 'click to view the definition of the Midmean')
mylabel <- paste(mymid,hyperlink('method_6.htm','Closest Observation',''),sep=' - ')
a<-table.element(a,mylabel,header=TRUE)
a<-table.element(a,midm[6])
a<-table.element(a,'')
a<-table.row.end(a)
a<-table.row.start(a)
mymid <- hyperlink('midmean.htm', 'Midmean', 'click to view the definition of the Midmean')
mylabel <- paste(mymid,hyperlink('method_7.htm','True Basic - Statistics Graphics Toolkit',''),sep=' - ')
a<-table.element(a,mylabel,header=TRUE)
a<-table.element(a,midm[7])
a<-table.element(a,'')
a<-table.row.end(a)
a<-table.row.start(a)
mymid <- hyperlink('midmean.htm', 'Midmean', 'click to view the definition of the Midmean')
mylabel <- paste(mymid,hyperlink('method_8.htm','MS Excel (old versions)',''),sep=' - ')
a<-table.element(a,mylabel,header=TRUE)
a<-table.element(a,midm[8])
a<-table.element(a,'')
a<-table.row.end(a)
a<-table.row.start(a)
a<-table.element(a,'Number of observations',header=TRUE)
a<-table.element(a,length(x))
a<-table.element(a,'')
a<-table.row.end(a)
a<-table.end(a)
table.save(a,file='mytable.tab')