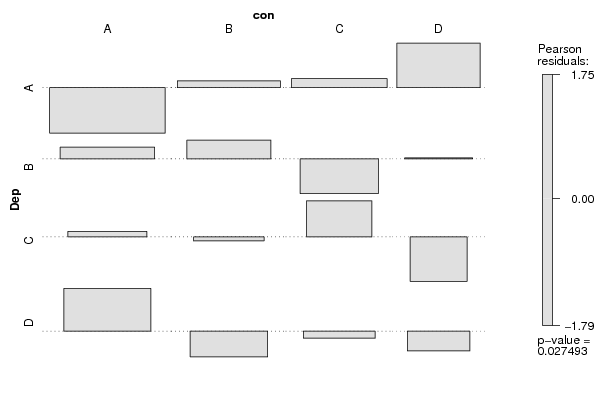
| Tabulation of Results | ||||
| Dep x con | ||||
| A | B | C | D | A | 12 | 17 | 15 | 16 | B | 15 | 13 | 5 | 7 | C | 10 | 7 | 10 | 1 | D | 17 | 6 | 7 | 4 |
| Tabulation of Expected Results | ||||
| Dep x con | ||||
| A | B | C | D | A | 20 | 15.93 | 13.7 | 10.37 | B | 13.33 | 10.62 | 9.14 | 6.91 | C | 9.33 | 7.43 | 6.4 | 4.84 | D | 11.33 | 9.02 | 7.77 | 5.88 |
| Statistical Results | |
| Pearson's Chi-squared test with simulated p-value (based on 2000 replicates) | |
| Chi Square Statistic | 18.74 |
| P value | 0.03 |