| Multiple Linear Regression - Estimated Regression Equation |
| aantalrokers[t] = + 1017.5 -154.566666666667rookverbod[t] + e[t] |
| Multiple Linear Regression - Ordinary Least Squares | |||||
| Variable | Parameter | S.D. | T-STAT H0: parameter = 0 | 2-tail p-value | 1-tail p-value |
| (Intercept) | 1017.5 | 92.001195 | 11.0596 | 0 | 0 |
| rookverbod | -154.566666666667 | 113.92309 | -1.3568 | 0.189263 | 0.094632 |
| Multiple Linear Regression - Regression Statistics | |
| Multiple R | 0.283888870392276 |
| R-squared | 0.0805928907326025 |
| Adjusted R-squared | 0.0368115998151073 |
| F-TEST (value) | 1.84080663323697 |
| F-TEST (DF numerator) | 1 |
| F-TEST (DF denominator) | 21 |
| p-value | 0.189263185264393 |
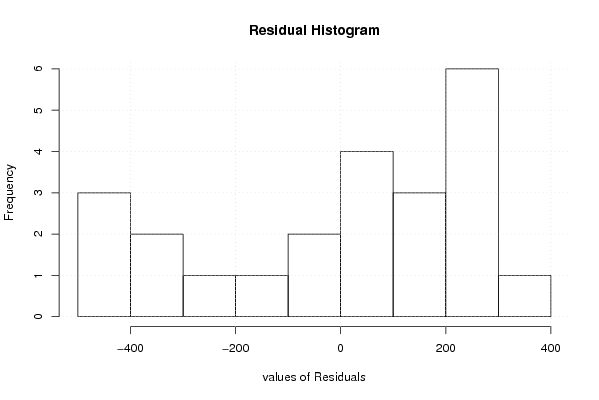
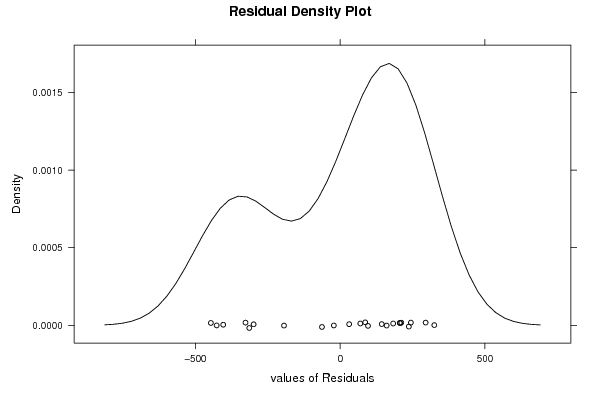
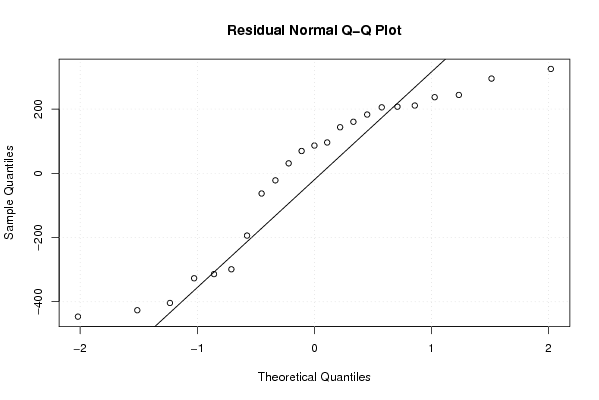
| Multiple Linear Regression - Residual Statistics | |
| Residual Standard Deviation | 260.218674829765 |
| Sum Squared Residuals | 1421988.93333333 |
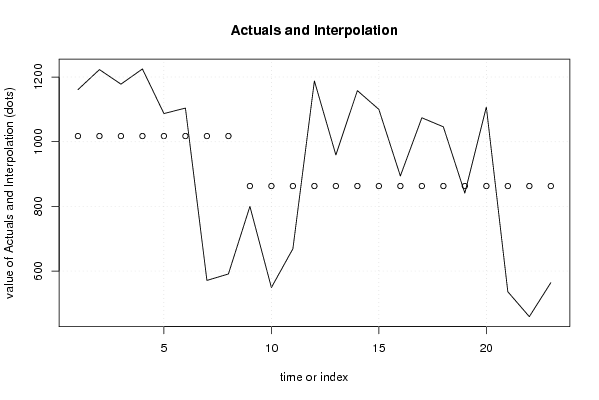
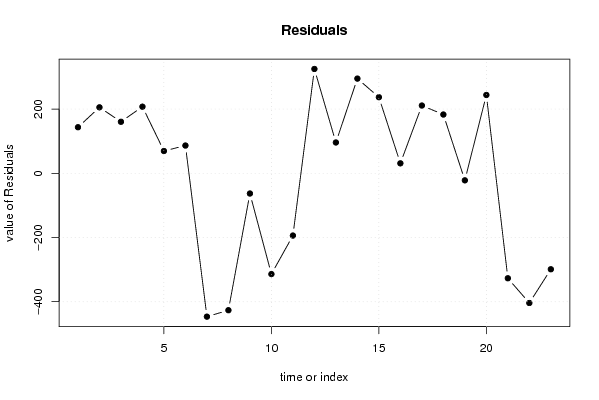
| Multiple Linear Regression - Actuals, Interpolation, and Residuals | |||
| Time or Index | Actuals | Interpolation Forecast | Residuals Prediction Error |
| 1 | 1161 | 1017.5 | 143.500000000000 |
| 2 | 1223 | 1017.5 | 205.5 |
| 3 | 1178 | 1017.5 | 160.5 |
| 4 | 1225 | 1017.5 | 207.5 |
| 5 | 1087 | 1017.5 | 69.5 |
| 6 | 1104 | 1017.5 | 86.5 |
| 7 | 571 | 1017.5 | -446.5 |
| 8 | 591 | 1017.5 | -426.5 |
| 9 | 800 | 862.933333333333 | -62.9333333333334 |
| 10 | 549 | 862.933333333333 | -313.933333333333 |
| 11 | 669 | 862.933333333333 | -193.933333333333 |
| 12 | 1188 | 862.933333333333 | 325.066666666667 |
| 13 | 959 | 862.933333333333 | 96.0666666666666 |
| 14 | 1158 | 862.933333333333 | 295.066666666667 |
| 15 | 1100 | 862.933333333333 | 237.066666666667 |
| 16 | 894 | 862.933333333333 | 31.0666666666667 |
| 17 | 1074 | 862.933333333333 | 211.066666666667 |
| 18 | 1046 | 862.933333333333 | 183.066666666667 |
| 19 | 841 | 862.933333333333 | -21.9333333333333 |
| 20 | 1107 | 862.933333333333 | 244.066666666667 |
| 21 | 536 | 862.933333333333 | -326.933333333333 |
| 22 | 459 | 862.933333333333 | -403.933333333333 |
| 23 | 564 | 862.933333333333 | -298.933333333333 |