| Tabulation of Results | ||
| outgoing x popular | ||
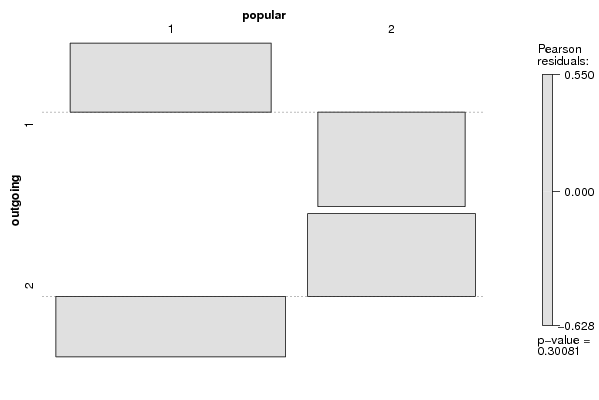
| 1 | 2 | 1 | 46 | 20 | 2 | 53 | 33 |
| Tabulation of Expected Results | ||
| outgoing x popular | ||
| 1 | 2 | 1 | 42.99 | 23.01 | 2 | 56.01 | 29.99 |
| Statistical Results | |
| Pearson's Chi-squared test with Yates' continuity correction | |
| Chi Square Statistic | 0.74 |
| Degrees of Freedom | 1 |
| P value | 0.39 |