| Multiple Linear Regression - Estimated Regression Equation |
| WLHC[t] = + 445.833333333333 + 2.78472222222229M1[t] + 15.7777777777777M2[t] + 23.2708333333333M3[t] + 12.2638888888889M4[t] + 2.00694444444442M5[t] + 4.49999999999997M6[t] + 9.99305555555553M7[t] + 7.9861111111111M8[t] + 11.2708333333333M9[t] + 10.8472222222222M10[t] + 5.09027777777776M11[t] -1.24305555555556t + e[t] |
| Multiple Linear Regression - Ordinary Least Squares | |||||
| Variable | Parameter | S.D. | T-STAT H0: parameter = 0 | 2-tail p-value | 1-tail p-value |
| (Intercept) | 445.833333333333 | 10.79999 | 41.2809 | 0 | 0 |
| M1 | 2.78472222222229 | 12.818276 | 0.2172 | 0.82944 | 0.41472 |
| M2 | 15.7777777777777 | 12.80405 | 1.2322 | 0.227121 | 0.11356 |
| M3 | 23.2708333333333 | 12.792975 | 1.819 | 0.078578 | 0.039289 |
| M4 | 12.2638888888889 | 12.785058 | 0.9592 | 0.344862 | 0.172431 |
| M5 | 2.00694444444442 | 12.780305 | 0.157 | 0.876236 | 0.438118 |
| M6 | 4.49999999999997 | 12.778721 | 0.3521 | 0.72711 | 0.363555 |
| M7 | 9.99305555555553 | 12.780305 | 0.7819 | 0.440199 | 0.220099 |
| M8 | 7.9861111111111 | 12.785058 | 0.6246 | 0.536775 | 0.268388 |
| M9 | 11.2708333333333 | 13.674361 | 0.8242 | 0.416105 | 0.208053 |
| M10 | 10.8472222222222 | 13.666955 | 0.7937 | 0.433414 | 0.216707 |
| M11 | 5.09027777777776 | 13.662509 | 0.3726 | 0.712002 | 0.356001 |
| t | -1.24305555555556 | 0.201246 | -6.1768 | 1e-06 | 0 |
| Multiple Linear Regression - Regression Statistics | |
| Multiple R | 0.776743839654537 |
| R-squared | 0.603330992441273 |
| Adjusted R-squared | 0.449781699192734 |
| F-TEST (value) | 3.92923327536717 |
| F-TEST (DF numerator) | 12 |
| F-TEST (DF denominator) | 31 |
| p-value | 0.00104600699942448 |
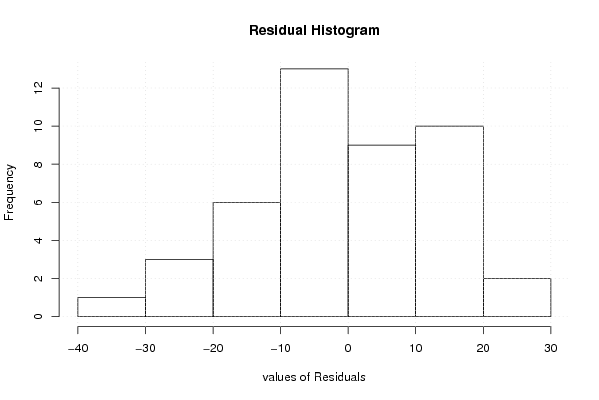
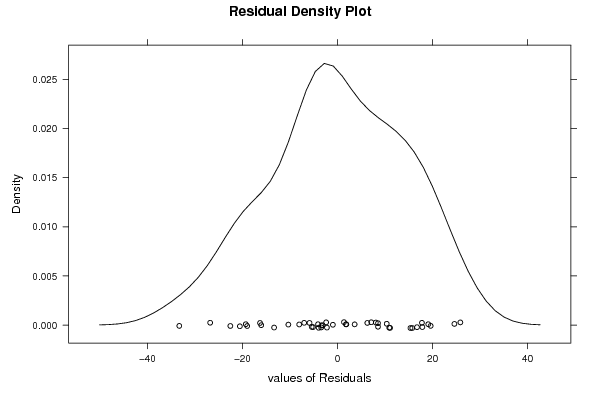
| Multiple Linear Regression - Residual Statistics | |
| Residual Standard Deviation | 16.7312726315414 |
| Sum Squared Residuals | 8678 |
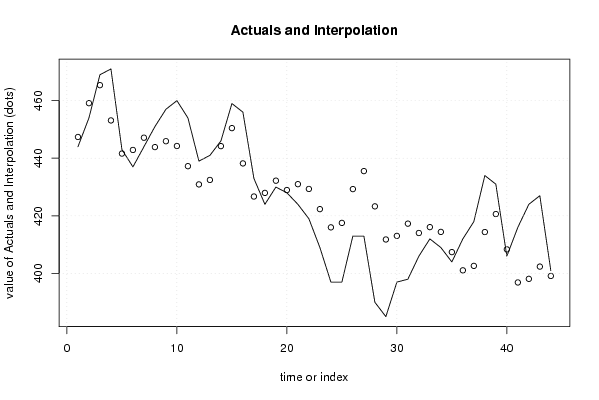
| Multiple Linear Regression - Actuals, Interpolation, and Residuals | |||
| Time or Index | Actuals | Interpolation Forecast | Residuals Prediction Error |
| 1 | 444 | 447.375 | -3.37499999999982 |
| 2 | 454 | 459.125 | -5.12500000000005 |
| 3 | 469 | 465.375 | 3.625 |
| 4 | 471 | 453.125 | 17.875 |
| 5 | 443 | 441.625 | 1.37499999999999 |
| 6 | 437 | 442.875 | -5.87500000000002 |
| 7 | 444 | 447.125 | -3.12500000000001 |
| 8 | 451 | 443.875 | 7.12499999999999 |
| 9 | 457 | 445.916666666667 | 11.0833333333333 |
| 10 | 460 | 444.25 | 15.75 |
| 11 | 454 | 437.25 | 16.7500000000000 |
| 12 | 439 | 430.916666666667 | 8.0833333333333 |
| 13 | 441 | 432.458333333333 | 8.5416666666666 |
| 14 | 446 | 444.208333333333 | 1.79166666666668 |
| 15 | 459 | 450.458333333333 | 8.54166666666667 |
| 16 | 456 | 438.208333333333 | 17.7916666666667 |
| 17 | 433 | 426.708333333333 | 6.29166666666666 |
| 18 | 424 | 427.958333333333 | -3.95833333333334 |
| 19 | 430 | 432.208333333333 | -2.20833333333335 |
| 20 | 428 | 428.958333333333 | -0.958333333333342 |
| 21 | 424 | 431 | -7 |
| 22 | 419 | 429.333333333333 | -10.3333333333333 |
| 23 | 409 | 422.333333333333 | -13.3333333333333 |
| 24 | 397 | 416 | -19 |
| 25 | 397 | 417.541666666667 | -20.5416666666667 |
| 26 | 413 | 429.291666666667 | -16.2916666666667 |
| 27 | 413 | 435.541666666667 | -22.5416666666667 |
| 28 | 390 | 423.291666666667 | -33.2916666666667 |
| 29 | 385 | 411.791666666667 | -26.7916666666667 |
| 30 | 397 | 413.041666666667 | -16.0416666666667 |
| 31 | 398 | 417.291666666667 | -19.2916666666667 |
| 32 | 406 | 414.041666666667 | -8.04166666666667 |
| 33 | 412 | 416.083333333333 | -4.08333333333333 |
| 34 | 409 | 414.416666666667 | -5.41666666666666 |
| 35 | 404 | 407.416666666667 | -3.41666666666665 |
| 36 | 412 | 401.083333333333 | 10.9166666666667 |
| 37 | 418 | 402.625 | 15.3749999999999 |
| 38 | 434 | 414.375 | 19.6250000000000 |
| 39 | 431 | 420.625 | 10.3750000000000 |
| 40 | 406 | 408.375 | -2.37499999999999 |
| 41 | 416 | 396.875 | 19.125 |
| 42 | 424 | 398.125 | 25.875 |
| 43 | 427 | 402.375 | 24.625 |
| 44 | 401 | 399.125 | 1.87500000000002 |
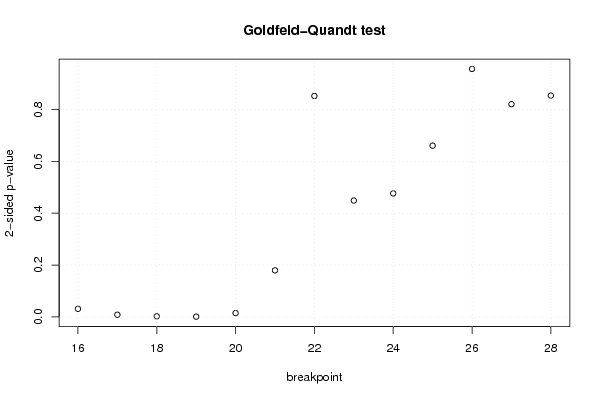
| Goldfeld-Quandt test for Heteroskedasticity | |||
| p-values | Alternative Hypothesis | ||
| breakpoint index | greater | 2-sided | less |
| 16 | 0.0155628285698763 | 0.0311256571397526 | 0.984437171430124 |
| 17 | 0.00416655703412741 | 0.00833311406825481 | 0.995833442965873 |
| 18 | 0.00119007339620067 | 0.00238014679240135 | 0.9988099266038 |
| 19 | 0.000495900451935291 | 0.000991800903870583 | 0.999504099548065 |
| 20 | 0.00738597780651542 | 0.0147719556130308 | 0.992614022193485 |
| 21 | 0.0897441706671634 | 0.179488341334327 | 0.910255829332837 |
| 22 | 0.425990054467932 | 0.851980108935864 | 0.574009945532068 |
| 23 | 0.775597910779993 | 0.448804178440014 | 0.224402089220007 |
| 24 | 0.761869829369551 | 0.476260341260897 | 0.238130170630449 |
| 25 | 0.669812891751507 | 0.660374216496987 | 0.330187108248493 |
| 26 | 0.521878486645363 | 0.956243026709274 | 0.478121513354637 |
| 27 | 0.410195185252954 | 0.820390370505908 | 0.589804814747046 |
| 28 | 0.426804465182802 | 0.853608930365604 | 0.573195534817198 |
| Meta Analysis of Goldfeld-Quandt test for Heteroskedasticity | |||
| Description | # significant tests | % significant tests | OK/NOK |
| 1% type I error level | 3 | 0.230769230769231 | NOK |
| 5% type I error level | 5 | 0.384615384615385 | NOK |
| 10% type I error level | 5 | 0.384615384615385 | NOK |