| Multiple Linear Regression - Estimated Regression Equation |
| Tarwe[t] = + 245.128295454545 -14.3083825757576M1[t] -4.39310606060605M2[t] -2.29782954545454M3[t] -16.0805530303030M4[t] -18.4272765151515M5[t] -14.264M6[t] -12.0287234848485M7[t] -3.02344696969697M8[t] + 5.86982954545454M9[t] + 0.295106060606054M10[t] -8.29577651515151M11[t] + 0.156723484848486t + e[t] |
| Multiple Linear Regression - Ordinary Least Squares | |||||
| Variable | Parameter | S.D. | T-STAT H0: parameter = 0 | 2-tail p-value | 1-tail p-value |
| (Intercept) | 245.128295454545 | 41.321677 | 5.9322 | 0 | 0 |
| M1 | -14.3083825757576 | 50.130717 | -0.2854 | 0.776631 | 0.388315 |
| M2 | -4.39310606060605 | 50.099169 | -0.0877 | 0.930514 | 0.465257 |
| M3 | -2.29782954545454 | 50.074619 | -0.0459 | 0.963602 | 0.481801 |
| M4 | -16.0805530303030 | 50.057075 | -0.3212 | 0.749513 | 0.374756 |
| M5 | -18.4272765151515 | 50.046546 | -0.3682 | 0.714448 | 0.357224 |
| M6 | -14.264 | 50.043036 | -0.285 | 0.776925 | 0.388463 |
| M7 | -12.0287234848485 | 50.046546 | -0.2404 | 0.81115 | 0.405575 |
| M8 | -3.02344696969697 | 50.057075 | -0.0604 | 0.952105 | 0.476052 |
| M9 | 5.86982954545454 | 50.074619 | 0.1172 | 0.907206 | 0.453603 |
| M10 | 0.295106060606054 | 50.099169 | 0.0059 | 0.995326 | 0.497663 |
| M11 | -8.29577651515151 | 52.753321 | -0.1573 | 0.875747 | 0.437873 |
| t | 0.156723484848486 | 0.592734 | 0.2644 | 0.792673 | 0.396336 |
| Multiple Linear Regression - Regression Statistics | |
| Multiple R | 0.122409353781914 |
| R-squared | 0.0149840498933058 |
| Adjusted R-squared | -0.247686870135146 |
| F-TEST (value) | 0.057044951499324 |
| F-TEST (DF numerator) | 12 |
| F-TEST (DF denominator) | 45 |
| p-value | 0.999997131728267 |
| Multiple Linear Regression - Residual Statistics | |
| Residual Standard Deviation | 74.599753247114 |
| Sum Squared Residuals | 250430.543303864 |
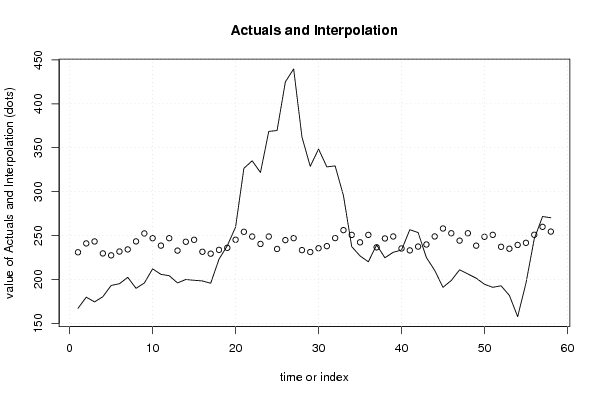
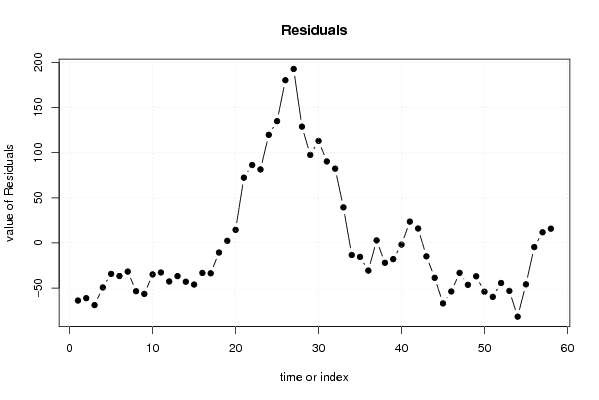
| Multiple Linear Regression - Actuals, Interpolation, and Residuals | |||
| Time or Index | Actuals | Interpolation Forecast | Residuals Prediction Error |
| 1 | 167.16 | 230.976636363637 | -63.8166363636367 |
| 2 | 179.84 | 241.048636363636 | -61.2086363636364 |
| 3 | 174.44 | 243.300636363636 | -68.8606363636364 |
| 4 | 180.35 | 229.674636363636 | -49.3246363636364 |
| 5 | 193.17 | 227.484636363636 | -34.3146363636363 |
| 6 | 195.16 | 231.804636363636 | -36.6446363636363 |
| 7 | 202.43 | 234.196636363636 | -31.7666363636364 |
| 8 | 189.91 | 243.358636363636 | -53.4486363636364 |
| 9 | 195.98 | 252.408636363636 | -56.4286363636363 |
| 10 | 212.09 | 246.990636363636 | -34.9006363636363 |
| 11 | 205.81 | 238.556477272727 | -32.7464772727273 |
| 12 | 204.31 | 247.008977272727 | -42.6989772727272 |
| 13 | 196.07 | 232.857318181818 | -36.7873181818181 |
| 14 | 199.98 | 242.929318181818 | -42.9493181818182 |
| 15 | 199.1 | 245.181318181818 | -46.0813181818182 |
| 16 | 198.31 | 231.555318181818 | -33.2453181818182 |
| 17 | 195.72 | 229.365318181818 | -33.6453181818182 |
| 18 | 223.04 | 233.685318181818 | -10.6453181818182 |
| 19 | 238.41 | 236.077318181818 | 2.33268181818182 |
| 20 | 259.73 | 245.239318181818 | 14.4906818181818 |
| 21 | 326.54 | 254.289318181818 | 72.2506818181818 |
| 22 | 335.15 | 248.871318181818 | 86.2786818181818 |
| 23 | 321.81 | 240.437159090909 | 81.3728409090909 |
| 24 | 368.62 | 248.889659090909 | 119.730340909091 |
| 25 | 369.59 | 234.738 | 134.852 |
| 26 | 425 | 244.81 | 180.19 |
| 27 | 439.72 | 247.062 | 192.658 |
| 28 | 362.23 | 233.436 | 128.794 |
| 29 | 328.76 | 231.246 | 97.514 |
| 30 | 348.55 | 235.566 | 112.984 |
| 31 | 328.18 | 237.958 | 90.222 |
| 32 | 329.34 | 247.12 | 82.22 |
| 33 | 295.55 | 256.17 | 39.38 |
| 34 | 237.38 | 250.752 | -13.372 |
| 35 | 226.85 | 242.317840909091 | -15.4678409090909 |
| 36 | 220.14 | 250.770340909091 | -30.6303409090909 |
| 37 | 239.36 | 236.618681818182 | 2.74131818181828 |
| 38 | 224.69 | 246.690681818182 | -22.0006818181818 |
| 39 | 230.98 | 248.942681818182 | -17.9626818181818 |
| 40 | 233.47 | 235.316681818182 | -1.84668181818184 |
| 41 | 256.7 | 233.126681818182 | 23.5733181818182 |
| 42 | 253.41 | 237.446681818182 | 15.9633181818182 |
| 43 | 224.95 | 239.838681818182 | -14.8886818181818 |
| 44 | 210.37 | 249.000681818182 | -38.6306818181818 |
| 45 | 191.09 | 258.050681818182 | -66.9606818181818 |
| 46 | 198.85 | 252.632681818182 | -53.7826818181818 |
| 47 | 211.04 | 244.198522727273 | -33.1585227272727 |
| 48 | 206.25 | 252.651022727273 | -46.4010227272727 |
| 49 | 201.51 | 238.499363636364 | -36.9893636363636 |
| 50 | 194.54 | 248.571363636364 | -54.0313636363637 |
| 51 | 191.07 | 250.823363636364 | -59.7533636363637 |
| 52 | 192.82 | 237.197363636364 | -44.3773636363637 |
| 53 | 181.88 | 235.007363636364 | -53.1273636363636 |
| 54 | 157.67 | 239.327363636364 | -81.6573636363637 |
| 55 | 195.82 | 241.719363636364 | -45.8993636363637 |
| 56 | 246.25 | 250.881363636364 | -4.63136363636365 |
| 57 | 271.69 | 259.931363636364 | 11.7586363636363 |
| 58 | 270.29 | 254.513363636364 | 15.7766363636364 |
| Goldfeld-Quandt test for Heteroskedasticity | |||
| p-values | Alternative Hypothesis | ||
| breakpoint index | greater | 2-sided | less |
| 16 | 0.000218982994096329 | 0.000437965988192657 | 0.999781017005904 |
| 17 | 0.000394720255906879 | 0.000789440511813759 | 0.999605279744093 |
| 18 | 7.74192489404122e-05 | 0.000154838497880824 | 0.99992258075106 |
| 19 | 3.38841821778283e-05 | 6.77683643556565e-05 | 0.999966115817822 |
| 20 | 0.000646383814350474 | 0.00129276762870095 | 0.99935361618565 |
| 21 | 0.0304537793493947 | 0.0609075586987894 | 0.969546220650605 |
| 22 | 0.0555007953060735 | 0.111001590612147 | 0.944499204693927 |
| 23 | 0.0564350383581313 | 0.112870076716263 | 0.943564961641869 |
| 24 | 0.121879271959093 | 0.243758543918185 | 0.878120728040907 |
| 25 | 0.166978935935551 | 0.333957871871102 | 0.833021064064449 |
| 26 | 0.390707520267352 | 0.781415040534704 | 0.609292479732648 |
| 27 | 0.735417798868002 | 0.529164402263996 | 0.264582201131998 |
| 28 | 0.742591570557475 | 0.514816858885051 | 0.257408429442525 |
| 29 | 0.694529849963583 | 0.610940300072833 | 0.305470150036417 |
| 30 | 0.742563938516959 | 0.514872122966082 | 0.257436061483041 |
| 31 | 0.780145554837273 | 0.439708890325454 | 0.219854445162727 |
| 32 | 0.809301021437305 | 0.381397957125390 | 0.190698978562695 |
| 33 | 0.848207597701678 | 0.303584804596645 | 0.151792402298322 |
| 34 | 0.908749037111417 | 0.182501925777167 | 0.0912509628885834 |
| 35 | 0.918556786449526 | 0.162886427100948 | 0.0814432135504739 |
| 36 | 0.923599381372174 | 0.152801237255651 | 0.0764006186278257 |
| 37 | 0.905379424345912 | 0.189241151308175 | 0.0946205756540876 |
| 38 | 0.883756915659881 | 0.232486168680237 | 0.116243084340118 |
| 39 | 0.843833957969048 | 0.312332084061905 | 0.156166042030952 |
| 40 | 0.77202249386086 | 0.455955012278279 | 0.227977506139140 |
| 41 | 0.7386578308101 | 0.522684338379801 | 0.261342169189900 |
| 42 | 0.878782040125896 | 0.242435919748207 | 0.121217959874104 |
| Meta Analysis of Goldfeld-Quandt test for Heteroskedasticity | |||
| Description | # significant tests | % significant tests | OK/NOK |
| 1% type I error level | 5 | 0.185185185185185 | NOK |
| 5% type I error level | 5 | 0.185185185185185 | NOK |
| 10% type I error level | 6 | 0.222222222222222 | NOK |