| Multiple Linear Regression - Estimated Regression Equation |
| Y[t] = + 545.06511627907 -18.2604651162791X[t] + 14.3869767441861M1[t] + 9.586976744186M2[t] -0.613023255814025M3[t] -5.61302325581399M4[t] -18.6130232558140M5[t] -15.2130232558140M6[t] + 40.4390697674418M7[t] + 44.5651162790698M8[t] + 29.3151162790697M9[t] + 10.3151162790697M10[t] -1.93488372093025M11[t] + e[t] |
| Multiple Linear Regression - Ordinary Least Squares | |||||
| Variable | Parameter | S.D. | T-STAT H0: parameter = 0 | 2-tail p-value | 1-tail p-value |
| (Intercept) | 545.06511627907 | 17.613632 | 30.9456 | 0 | 0 |
| X | -18.2604651162791 | 10.62142 | -1.7192 | 0.092939 | 0.04647 |
| M1 | 14.3869767441861 | 23.367123 | 0.6157 | 0.541419 | 0.27071 |
| M2 | 9.586976744186 | 23.367123 | 0.4103 | 0.683689 | 0.341844 |
| M3 | -0.613023255814025 | 23.367123 | -0.0262 | 0.979195 | 0.489597 |
| M4 | -5.61302325581399 | 23.367123 | -0.2402 | 0.811336 | 0.405668 |
| M5 | -18.6130232558140 | 23.367123 | -0.7965 | 0.430194 | 0.215097 |
| M6 | -15.2130232558140 | 23.367123 | -0.651 | 0.518564 | 0.259282 |
| M7 | 40.4390697674418 | 23.415352 | 1.727 | 0.091511 | 0.045755 |
| M8 | 44.5651162790698 | 24.767502 | 1.7993 | 0.079153 | 0.039576 |
| M9 | 29.3151162790697 | 24.767502 | 1.1836 | 0.243223 | 0.121611 |
| M10 | 10.3151162790697 | 24.767502 | 0.4165 | 0.679181 | 0.339591 |
| M11 | -1.93488372093025 | 24.767502 | -0.0781 | 0.938102 | 0.469051 |
| Multiple Linear Regression - Regression Statistics | |
| Multiple R | 0.544603875494702 |
| R-squared | 0.296593381203849 |
| Adjusted R-squared | 0.095620061547806 |
| F-TEST (value) | 1.47578485398686 |
| F-TEST (DF numerator) | 12 |
| F-TEST (DF denominator) | 42 |
| p-value | 0.171893663081346 |
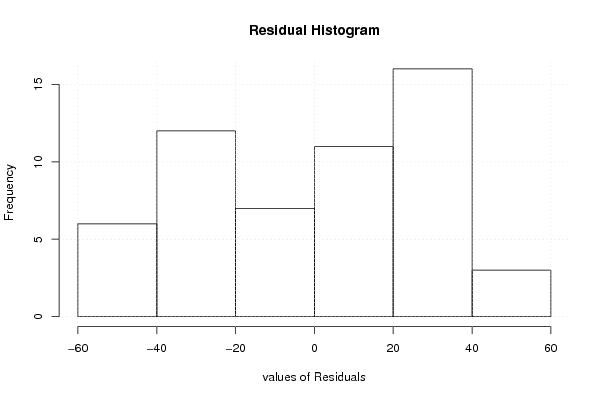
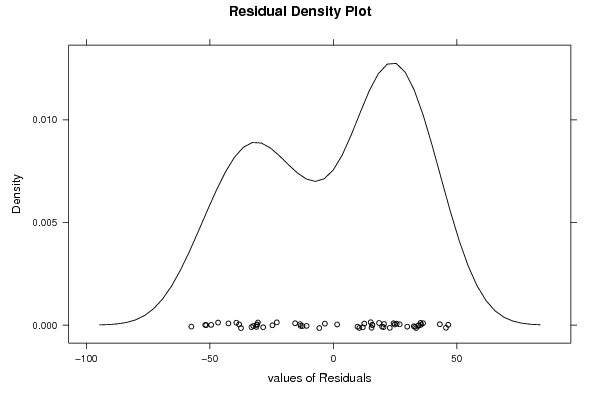
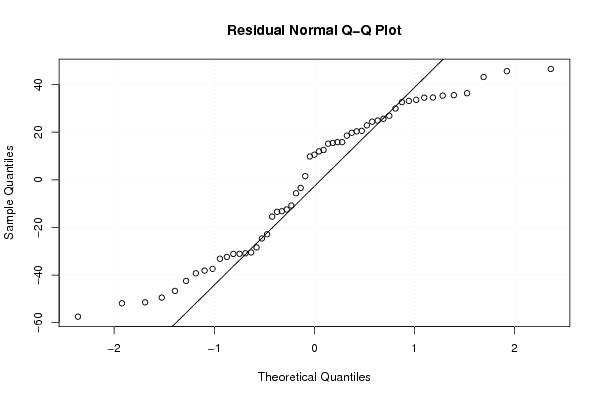
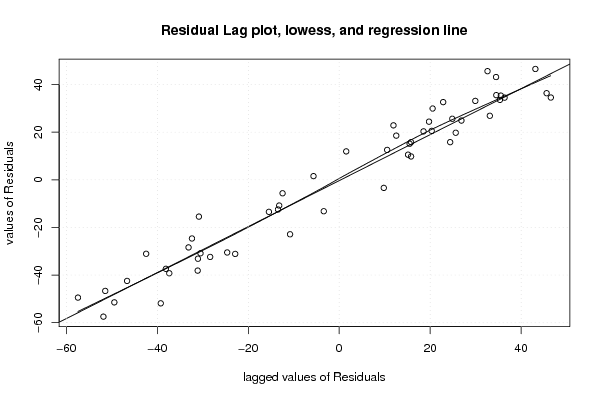
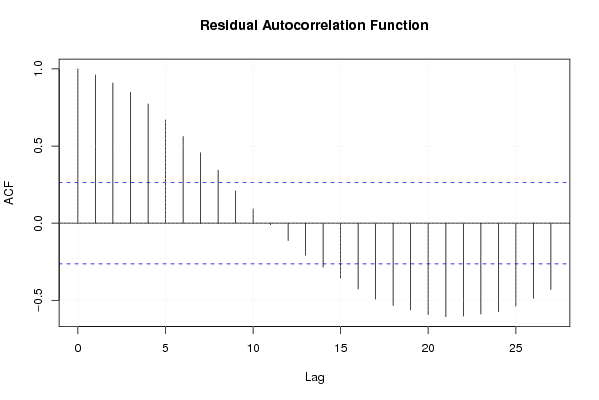
| Multiple Linear Regression - Residual Statistics | |
| Residual Standard Deviation | 34.8246528364997 |
| Sum Squared Residuals | 50935.7706976745 |
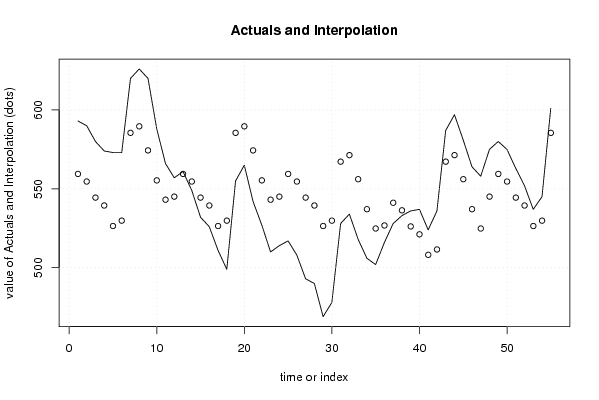
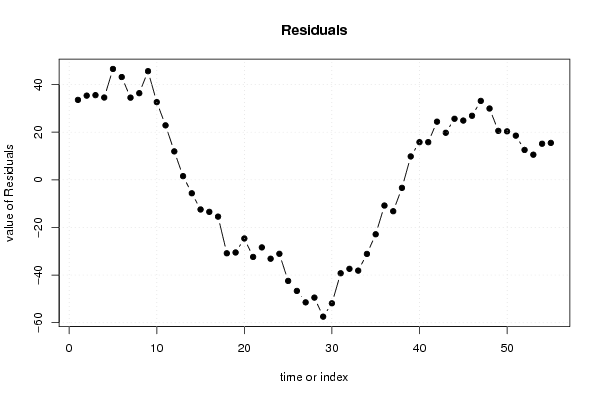
| Multiple Linear Regression - Actuals, Interpolation, and Residuals | |||
| Time or Index | Actuals | Interpolation Forecast | Residuals Prediction Error |
| 1 | 593 | 559.452093023255 | 33.5479069767446 |
| 2 | 590 | 554.652093023256 | 35.3479069767441 |
| 3 | 580 | 544.452093023256 | 35.5479069767442 |
| 4 | 574 | 539.452093023256 | 34.5479069767442 |
| 5 | 573 | 526.452093023256 | 46.5479069767442 |
| 6 | 573 | 529.852093023256 | 43.1479069767442 |
| 7 | 620 | 585.504186046512 | 34.4958139534884 |
| 8 | 626 | 589.63023255814 | 36.3697674418606 |
| 9 | 620 | 574.38023255814 | 45.6197674418605 |
| 10 | 588 | 555.38023255814 | 32.6197674418605 |
| 11 | 566 | 543.13023255814 | 22.8697674418605 |
| 12 | 557 | 545.06511627907 | 11.9348837209302 |
| 13 | 561 | 559.452093023256 | 1.54790697674409 |
| 14 | 549 | 554.652093023256 | -5.6520930232558 |
| 15 | 532 | 544.452093023256 | -12.4520930232558 |
| 16 | 526 | 539.452093023256 | -13.4520930232558 |
| 17 | 511 | 526.452093023256 | -15.4520930232558 |
| 18 | 499 | 529.852093023256 | -30.8520930232558 |
| 19 | 555 | 585.504186046512 | -30.5041860465116 |
| 20 | 565 | 589.63023255814 | -24.6302325581396 |
| 21 | 542 | 574.38023255814 | -32.3802325581395 |
| 22 | 527 | 555.38023255814 | -28.3802325581395 |
| 23 | 510 | 543.13023255814 | -33.1302325581395 |
| 24 | 514 | 545.06511627907 | -31.0651162790698 |
| 25 | 517 | 559.452093023256 | -42.4520930232559 |
| 26 | 508 | 554.652093023256 | -46.6520930232558 |
| 27 | 493 | 544.452093023256 | -51.4520930232558 |
| 28 | 490 | 539.452093023256 | -49.4520930232558 |
| 29 | 469 | 526.452093023256 | -57.4520930232558 |
| 30 | 478 | 529.852093023256 | -51.8520930232558 |
| 31 | 528 | 567.243720930232 | -39.2437209302325 |
| 32 | 534 | 571.36976744186 | -37.3697674418605 |
| 33 | 518 | 556.11976744186 | -38.1197674418605 |
| 34 | 506 | 537.11976744186 | -31.1197674418604 |
| 35 | 502 | 524.86976744186 | -22.8697674418605 |
| 36 | 516 | 526.804651162791 | -10.8046511627907 |
| 37 | 528 | 541.191627906977 | -13.1916279069768 |
| 38 | 533 | 536.391627906977 | -3.39162790697671 |
| 39 | 536 | 526.191627906977 | 9.8083720930233 |
| 40 | 537 | 521.191627906977 | 15.8083720930233 |
| 41 | 524 | 508.191627906977 | 15.8083720930232 |
| 42 | 536 | 511.591627906977 | 24.4083720930233 |
| 43 | 587 | 567.243720930233 | 19.7562790697675 |
| 44 | 597 | 571.36976744186 | 25.6302325581395 |
| 45 | 581 | 556.11976744186 | 24.8802325581395 |
| 46 | 564 | 537.11976744186 | 26.8802325581396 |
| 47 | 558 | 524.86976744186 | 33.1302325581395 |
| 48 | 575 | 545.06511627907 | 29.9348837209302 |
| 49 | 580 | 559.452093023256 | 20.5479069767441 |
| 50 | 575 | 554.652093023256 | 20.3479069767442 |
| 51 | 563 | 544.452093023256 | 18.5479069767442 |
| 52 | 552 | 539.452093023256 | 12.5479069767442 |
| 53 | 537 | 526.452093023256 | 10.5479069767442 |
| 54 | 545 | 529.852093023256 | 15.1479069767442 |
| 55 | 601 | 585.504186046512 | 15.4958139534884 |
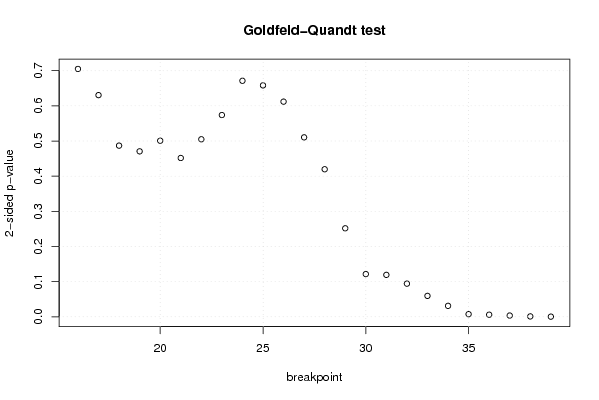
| Goldfeld-Quandt test for Heteroskedasticity | |||
| p-values | Alternative Hypothesis | ||
| breakpoint index | greater | 2-sided | less |
| 16 | 0.647500580122147 | 0.704998839755707 | 0.352499419877853 |
| 17 | 0.6847460672772 | 0.630507865445601 | 0.315253932722800 |
| 18 | 0.756572292249845 | 0.486855415500311 | 0.243427707750155 |
| 19 | 0.764685027048107 | 0.470629945903786 | 0.235314972951893 |
| 20 | 0.74961273621491 | 0.500774527570179 | 0.250387263785089 |
| 21 | 0.7741599367364 | 0.4516801265272 | 0.2258400632636 |
| 22 | 0.747535216405338 | 0.504929567189323 | 0.252464783594662 |
| 23 | 0.713055735914882 | 0.573888528170237 | 0.286944264085118 |
| 24 | 0.664336944034676 | 0.671326111930649 | 0.335663055965324 |
| 25 | 0.670851853108615 | 0.658296293782771 | 0.329148146891385 |
| 26 | 0.6940225018975 | 0.611954996204999 | 0.305977498102499 |
| 27 | 0.744801927955222 | 0.510396144089556 | 0.255198072044778 |
| 28 | 0.790173776207599 | 0.419652447584803 | 0.209826223792401 |
| 29 | 0.874161026631859 | 0.251677946736282 | 0.125838973368141 |
| 30 | 0.93927944909727 | 0.121441101805461 | 0.0607205509027304 |
| 31 | 0.940411922942748 | 0.119176154114505 | 0.0595880770572524 |
| 32 | 0.952881792474181 | 0.0942364150516376 | 0.0471182075258188 |
| 33 | 0.97031031437467 | 0.0593793712506608 | 0.0296896856253304 |
| 34 | 0.984486772928812 | 0.0310264541423750 | 0.0155132270711875 |
| 35 | 0.996319082384044 | 0.00736183523191169 | 0.00368091761595584 |
| 36 | 0.997096721501782 | 0.00580655699643694 | 0.00290327849821847 |
| 37 | 0.99826997209396 | 0.00346005581207825 | 0.00173002790603913 |
| 38 | 0.999501808964003 | 0.000996382071994351 | 0.000498191035997176 |
| 39 | 0.999839568366711 | 0.000320863266578067 | 0.000160431633289034 |
| Meta Analysis of Goldfeld-Quandt test for Heteroskedasticity | |||
| Description | # significant tests | % significant tests | OK/NOK |
| 1% type I error level | 5 | 0.208333333333333 | NOK |
| 5% type I error level | 6 | 0.25 | NOK |
| 10% type I error level | 8 | 0.333333333333333 | NOK |