| Multiple Linear Regression - Estimated Regression Equation |
| Y[t] = + 548.980793854033 -15.6216389244558X[t] + 13.7563540332907M1[t] + 9.10886683738792M2[t] -0.938620358514797M3[t] -5.78610755441745M4[t] -18.6335947503201M5[t] -15.0810819462229M6[t] + 40.1957586427657M7[t] + 43.2953585147247M8[t] + 28.197871318822M9[t] + 9.35038412291931M10[t] -2.74710307298338M11[t] -0.152512804097312t + e[t] |
| Multiple Linear Regression - Ordinary Least Squares | |||||
| Variable | Parameter | S.D. | T-STAT H0: parameter = 0 | 2-tail p-value | 1-tail p-value |
| (Intercept) | 548.980793854033 | 19.854263 | 27.6505 | 0 | 0 |
| X | -15.6216389244558 | 12.263542 | -1.2738 | 0.209898 | 0.104949 |
| M1 | 13.7563540332907 | 23.636591 | 0.582 | 0.563757 | 0.281879 |
| M2 | 9.10886683738792 | 23.61841 | 0.3857 | 0.701736 | 0.350868 |
| M3 | -0.938620358514797 | 23.605222 | -0.0398 | 0.968475 | 0.484237 |
| M4 | -5.78610755441745 | 23.597035 | -0.2452 | 0.807521 | 0.403761 |
| M5 | -18.6335947503201 | 23.593855 | -0.7898 | 0.434209 | 0.217105 |
| M6 | -15.0810819462229 | 23.595684 | -0.6391 | 0.526283 | 0.263142 |
| M7 | 40.1957586427657 | 23.648867 | 1.6997 | 0.096765 | 0.048383 |
| M8 | 43.2953585147247 | 25.171027 | 1.72 | 0.092965 | 0.046482 |
| M9 | 28.197871318822 | 25.134257 | 1.1219 | 0.268437 | 0.134218 |
| M10 | 9.35038412291931 | 25.102143 | 0.3725 | 0.711444 | 0.355722 |
| M11 | -2.74710307298338 | 25.0747 | -0.1096 | 0.913295 | 0.456648 |
| t | -0.152512804097312 | 0.343777 | -0.4436 | 0.659636 | 0.329818 |
| Multiple Linear Regression - Regression Statistics | |
| Multiple R | 0.54768043660878 |
| R-squared | 0.299953860643984 |
| Adjusted R-squared | 0.0779880115798813 |
| F-TEST (value) | 1.35135139891434 |
| F-TEST (DF numerator) | 13 |
| F-TEST (DF denominator) | 41 |
| p-value | 0.224618905356963 |
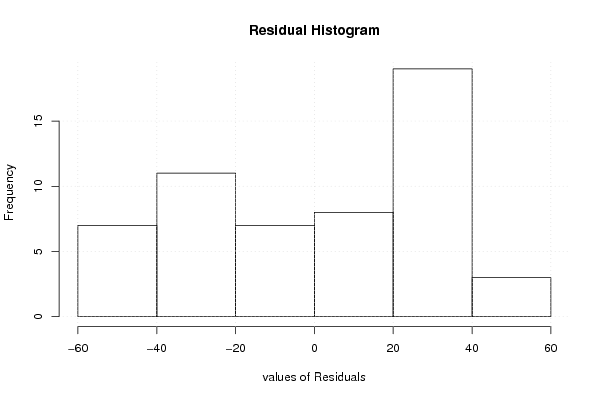
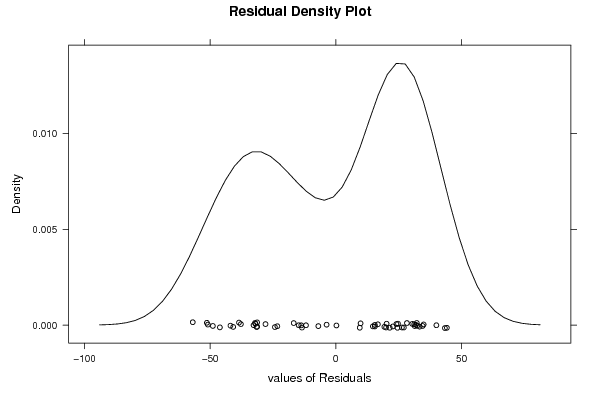
| Multiple Linear Regression - Residual Statistics | |
| Residual Standard Deviation | 35.1624898397931 |
| Sum Squared Residuals | 50692.4283610756 |
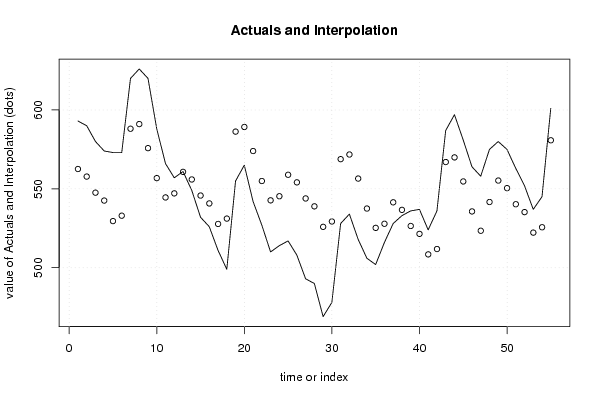
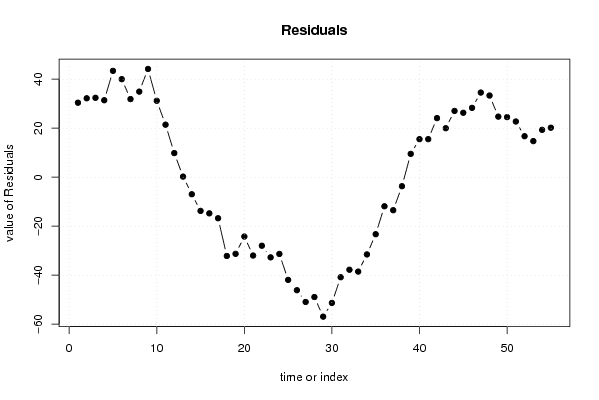
| Multiple Linear Regression - Actuals, Interpolation, and Residuals | |||
| Time or Index | Actuals | Interpolation Forecast | Residuals Prediction Error |
| 1 | 593 | 562.584635083226 | 30.4153649167738 |
| 2 | 590 | 557.784635083227 | 32.2153649167733 |
| 3 | 580 | 547.584635083227 | 32.4153649167733 |
| 4 | 574 | 542.584635083227 | 31.4153649167733 |
| 5 | 573 | 529.584635083227 | 43.4153649167734 |
| 6 | 573 | 532.984635083227 | 40.0153649167733 |
| 7 | 620 | 588.108962868118 | 31.8910371318822 |
| 8 | 626 | 591.056049935979 | 34.9439500640206 |
| 9 | 620 | 575.80604993598 | 44.1939500640205 |
| 10 | 588 | 556.80604993598 | 31.1939500640205 |
| 11 | 566 | 544.55604993598 | 21.4439500640205 |
| 12 | 557 | 547.150640204866 | 9.8493597951344 |
| 13 | 561 | 560.754481434059 | 0.245518565940993 |
| 14 | 549 | 555.954481434059 | -6.95448143405888 |
| 15 | 532 | 545.754481434059 | -13.7544814340589 |
| 16 | 526 | 540.754481434059 | -14.7544814340589 |
| 17 | 511 | 527.754481434059 | -16.7544814340589 |
| 18 | 499 | 531.154481434059 | -32.1544814340589 |
| 19 | 555 | 586.27880921895 | -31.2788092189501 |
| 20 | 565 | 589.225896286812 | -24.2258962868118 |
| 21 | 542 | 573.975896286812 | -31.9758962868118 |
| 22 | 527 | 554.975896286812 | -27.9758962868118 |
| 23 | 510 | 542.725896286812 | -32.7258962868118 |
| 24 | 514 | 545.320486555698 | -31.3204865556978 |
| 25 | 517 | 558.924327784891 | -41.9243277848912 |
| 26 | 508 | 554.124327784891 | -46.1243277848912 |
| 27 | 493 | 543.924327784891 | -50.9243277848912 |
| 28 | 490 | 538.924327784891 | -48.9243277848912 |
| 29 | 469 | 525.924327784891 | -56.9243277848912 |
| 30 | 478 | 529.324327784891 | -51.3243277848911 |
| 31 | 528 | 568.827016645326 | -40.8270166453265 |
| 32 | 534 | 571.774103713188 | -37.7741037131882 |
| 33 | 518 | 556.524103713188 | -38.5241037131882 |
| 34 | 506 | 537.524103713188 | -31.5241037131882 |
| 35 | 502 | 525.274103713188 | -23.2741037131882 |
| 36 | 516 | 527.868693982074 | -11.8686939820743 |
| 37 | 528 | 541.472535211268 | -13.4725352112677 |
| 38 | 533 | 536.672535211268 | -3.67253521126758 |
| 39 | 536 | 526.472535211268 | 9.52746478873243 |
| 40 | 537 | 521.472535211268 | 15.5274647887324 |
| 41 | 524 | 508.472535211268 | 15.5274647887324 |
| 42 | 536 | 511.872535211268 | 24.1274647887324 |
| 43 | 587 | 566.996862996159 | 20.0031370038412 |
| 44 | 597 | 569.94395006402 | 27.0560499359795 |
| 45 | 581 | 554.69395006402 | 26.3060499359795 |
| 46 | 564 | 535.69395006402 | 28.3060499359795 |
| 47 | 558 | 523.44395006402 | 34.5560499359795 |
| 48 | 575 | 541.660179257362 | 33.3398207426376 |
| 49 | 580 | 555.264020486556 | 24.7359795134442 |
| 50 | 575 | 550.464020486556 | 24.5359795134443 |
| 51 | 563 | 540.264020486556 | 22.7359795134443 |
| 52 | 552 | 535.264020486556 | 16.7359795134443 |
| 53 | 537 | 522.264020486556 | 14.7359795134443 |
| 54 | 545 | 525.664020486556 | 19.3359795134443 |
| 55 | 601 | 580.788348271447 | 20.2116517285532 |
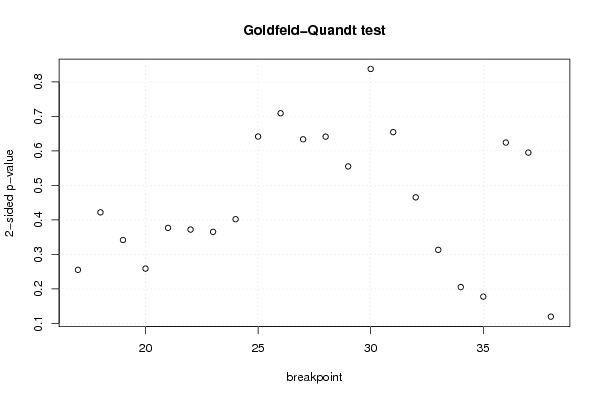
| Goldfeld-Quandt test for Heteroskedasticity | |||
| p-values | Alternative Hypothesis | ||
| breakpoint index | greater | 2-sided | less |
| 17 | 0.127739725014687 | 0.255479450029374 | 0.872260274985313 |
| 18 | 0.211051994838156 | 0.422103989676313 | 0.788948005161843 |
| 19 | 0.170988108825653 | 0.341976217651306 | 0.829011891174347 |
| 20 | 0.129538204056332 | 0.259076408112663 | 0.870461795943668 |
| 21 | 0.188479265751311 | 0.376958531502622 | 0.811520734248689 |
| 22 | 0.186089227159176 | 0.372178454318353 | 0.813910772840824 |
| 23 | 0.182767825972179 | 0.365535651944358 | 0.817232174027821 |
| 24 | 0.201092288605861 | 0.402184577211722 | 0.798907711394139 |
| 25 | 0.320852056232129 | 0.641704112464258 | 0.679147943767871 |
| 26 | 0.354571962230070 | 0.709143924460139 | 0.64542803776993 |
| 27 | 0.316848604809756 | 0.633697209619512 | 0.683151395190244 |
| 28 | 0.320666239527223 | 0.641332479054446 | 0.679333760472777 |
| 29 | 0.277574072508015 | 0.55514814501603 | 0.722425927491985 |
| 30 | 0.418751866960946 | 0.837503733921891 | 0.581248133039054 |
| 31 | 0.327234095001557 | 0.654468190003114 | 0.672765904998443 |
| 32 | 0.232789708155363 | 0.465579416310726 | 0.767210291844637 |
| 33 | 0.156690139849239 | 0.313380279698479 | 0.84330986015076 |
| 34 | 0.102736610549624 | 0.205473221099248 | 0.897263389450376 |
| 35 | 0.0889452754029998 | 0.177890550806000 | 0.911054724597 |
| 36 | 0.312124816251882 | 0.624249632503763 | 0.687875183748118 |
| 37 | 0.702424084180866 | 0.595151831638267 | 0.297575915819134 |
| 38 | 0.940074572880967 | 0.119850854238065 | 0.0599254271190326 |
| Meta Analysis of Goldfeld-Quandt test for Heteroskedasticity | |||
| Description | # significant tests | % significant tests | OK/NOK |
| 1% type I error level | 0 | 0 | OK |
| 5% type I error level | 0 | 0 | OK |
| 10% type I error level | 0 | 0 | OK |