| Multiple Linear Regression - Estimated Regression Equation |
| Maandelijksewerkloosheid[t] = + 6.06645265428026 + 6.51400634022988x[t] + 1.04111636612974`y-1`[t] -0.0567105374733346`y-2`[t] -1.78757398818603M1[t] -1.38927597259309M2[t] -3.46312965581879M3[t] + 1.39314919046846M4[t] + 17.4477569184918M5[t] + 0.647957883429362M6[t] -5.98306251125522M7[t] -3.6123360833013M8[t] -4.38508073448924M9[t] + 7.56499978638544M10[t] + 3.54606068516857M11[t] -0.112186792756548t + e[t] |
| Multiple Linear Regression - Ordinary Least Squares | |||||
| Variable | Parameter | S.D. | T-STAT H0: parameter = 0 | 2-tail p-value | 1-tail p-value |
| (Intercept) | 6.06645265428026 | 12.975936 | 0.4675 | 0.641978 | 0.320989 |
| x | 6.51400634022988 | 2.269125 | 2.8707 | 0.005803 | 0.002902 |
| `y-1` | 1.04111636612974 | 0.135979 | 7.6565 | 0 | 0 |
| `y-2` | -0.0567105374733346 | 0.139013 | -0.408 | 0.684893 | 0.342446 |
| M1 | -1.78757398818603 | 2.901074 | -0.6162 | 0.54032 | 0.27016 |
| M2 | -1.38927597259309 | 2.958344 | -0.4696 | 0.640488 | 0.320244 |
| M3 | -3.46312965581879 | 3.01557 | -1.1484 | 0.255767 | 0.127884 |
| M4 | 1.39314919046846 | 3.052924 | 0.4563 | 0.649948 | 0.324974 |
| M5 | 17.4477569184918 | 2.900739 | 6.0149 | 0 | 0 |
| M6 | 0.647957883429362 | 3.417894 | 0.1896 | 0.850338 | 0.425169 |
| M7 | -5.98306251125522 | 2.910269 | -2.0558 | 0.044556 | 0.022278 |
| M8 | -3.6123360833013 | 3.198459 | -1.1294 | 0.263631 | 0.131816 |
| M9 | -4.38508073448924 | 3.067963 | -1.4293 | 0.15857 | 0.079285 |
| M10 | 7.56499978638544 | 3.088139 | 2.4497 | 0.01751 | 0.008755 |
| M11 | 3.54606068516857 | 2.895201 | 1.2248 | 0.225868 | 0.112934 |
| t | -0.112186792756548 | 0.067224 | -1.6689 | 0.10083 | 0.050415 |
| Multiple Linear Regression - Regression Statistics | |
| Multiple R | 0.992938292177012 |
| R-squared | 0.985926452071402 |
| Adjusted R-squared | 0.982088211727238 |
| F-TEST (value) | 256.869389008090 |
| F-TEST (DF numerator) | 15 |
| F-TEST (DF denominator) | 55 |
| p-value | 0 |
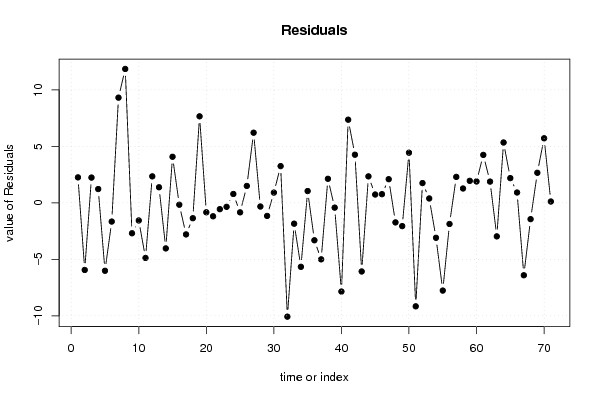
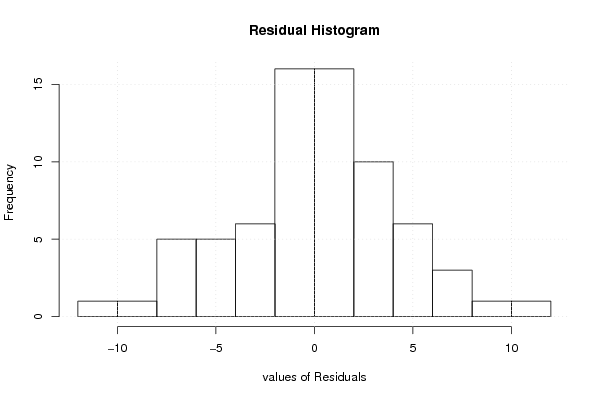
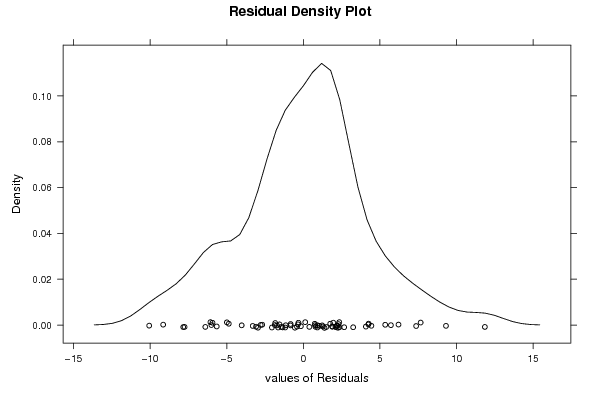
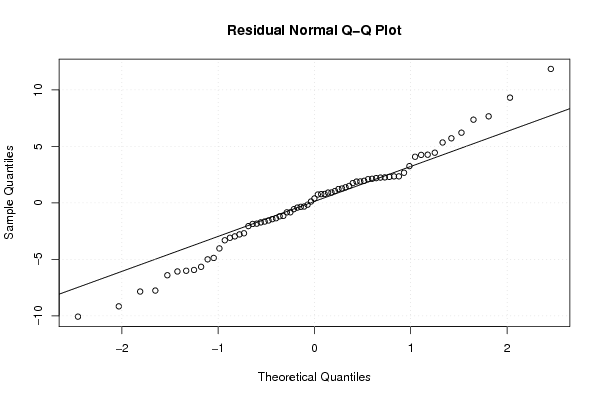
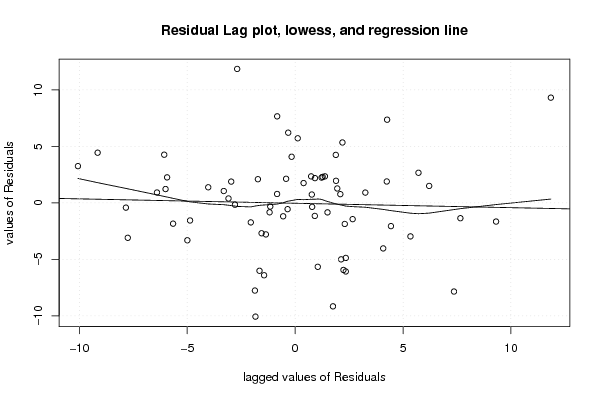
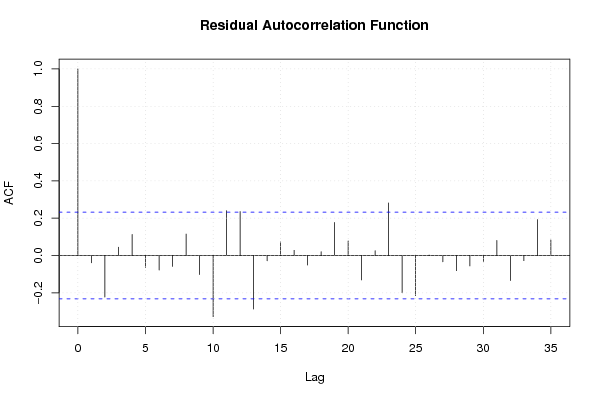
| Multiple Linear Regression - Residual Statistics | |
| Residual Standard Deviation | 4.71073709484016 |
| Sum Squared Residuals | 1220.50741871867 |
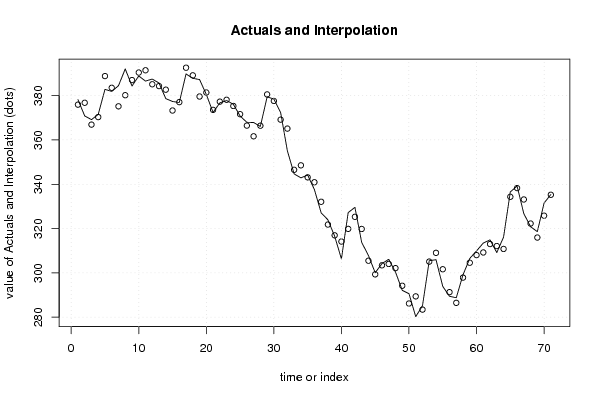
| Multiple Linear Regression - Actuals, Interpolation, and Residuals | |||
| Time or Index | Actuals | Interpolation Forecast | Residuals Prediction Error |
| 1 | 378.205 | 375.94714929417 | 2.25785070583032 |
| 2 | 370.861 | 376.792504661141 | -5.93150466114085 |
| 3 | 369.167 | 366.928010454330 | 2.23898954567037 |
| 4 | 371.551 | 370.324933570841 | 1.22606642915933 |
| 5 | 382.842 | 388.845443573441 | -6.00344357344062 |
| 6 | 381.903 | 383.553504714256 | -1.65050471425601 |
| 7 | 384.502 | 375.192370580408 | 9.30962941959232 |
| 8 | 392.058 | 380.210022845864 | 11.8479771541363 |
| 9 | 384.359 | 387.044375977502 | -2.6853759775023 |
| 10 | 388.884 | 390.438209981639 | -1.55420998163903 |
| 11 | 386.586 | 391.45475007241 | -4.86875007240991 |
| 12 | 387.495 | 385.147402003052 | 2.34759799694818 |
| 13 | 385.705 | 384.324336814035 | 1.38066318596509 |
| 14 | 378.67 | 382.695299862936 | -4.02529986293576 |
| 15 | 377.367 | 373.286517613308 | 4.08048238669189 |
| 16 | 376.911 | 377.072993672897 | -0.161993672896697 |
| 17 | 389.827 | 392.614559375536 | -2.78755937553608 |
| 18 | 387.82 | 389.175492537737 | -1.35549253773660 |
| 19 | 387.267 | 379.610291501467 | 7.65670849853251 |
| 20 | 380.575 | 381.406911834904 | -0.831911834904114 |
| 21 | 372.402 | 373.586190596042 | -1.18419059604217 |
| 22 | 376.74 | 377.294547180554 | -0.554547180553501 |
| 23 | 377.795 | 378.143279305620 | -0.348279305620464 |
| 24 | 376.126 | 375.337399282403 | 0.788600717597068 |
| 25 | 370.804 | 371.640185669355 | -0.836185669355417 |
| 26 | 367.98 | 366.480125478692 | 1.4998745213077 |
| 27 | 367.866 | 361.655785865193 | 6.21021413480716 |
| 28 | 366.121 | 366.441341210809 | -0.320341210809422 |
| 29 | 379.421 | 380.573479088452 | -1.15247908845178 |
| 30 | 378.519 | 377.607300818049 | 0.911699181950759 |
| 31 | 372.423 | 369.170756519964 | 3.25224348003624 |
| 32 | 355.072 | 365.133803692035 | -10.0618036920352 |
| 33 | 344.693 | 346.530169615811 | -1.83716961581112 |
| 34 | 342.892 | 348.546301115568 | -5.6543011155685 |
| 35 | 344.178 | 343.128723314631 | 1.04927668536882 |
| 36 | 337.606 | 340.911487161538 | -3.30548716153839 |
| 37 | 327.103 | 332.096579871200 | -4.99357987120045 |
| 38 | 323.953 | 321.820547552851 | 2.13245244714898 |
| 39 | 316.532 | 316.950621298642 | -0.418621298642485 |
| 40 | 306.307 | 314.147226992165 | -7.8402269921654 |
| 41 | 327.225 | 319.865081982345 | 7.35991801765472 |
| 42 | 329.573 | 325.311033546893 | 4.26196645310698 |
| 43 | 313.761 | 319.826096564257 | -6.0650965642572 |
| 44 | 307.836 | 305.489347876224 | 2.34665212377615 |
| 45 | 300.074 | 299.332508981489 | 0.741491018510982 |
| 46 | 304.198 | 303.425267410238 | 0.772732589762322 |
| 47 | 306.122 | 304.027892602051 | 2.09410739794875 |
| 48 | 300.414 | 302.13887875602 | -1.72487875601977 |
| 49 | 292.133 | 294.18731468311 | -2.05431468310993 |
| 50 | 290.616 | 286.175645025924 | 4.44035497407624 |
| 51 | 280.244 | 289.393857323569 | -9.1498573235692 |
| 52 | 285.179 | 283.425520312949 | 1.75347968705057 |
| 53 | 305.486 | 305.09405220974 | 0.391947790260164 |
| 54 | 305.957 | 309.044149926487 | -3.08714992648651 |
| 55 | 293.886 | 301.639687663022 | -7.75368766302145 |
| 56 | 289.441 | 291.304200979517 | -1.86320097951692 |
| 57 | 288.776 | 286.476060185966 | 2.29993981403372 |
| 58 | 299.149 | 297.873689869677 | 1.27531013032284 |
| 59 | 306.532 | 304.579776548987 | 1.95222345101272 |
| 60 | 309.914 | 308.019832796987 | 1.89416720301292 |
| 61 | 313.468 | 309.222433668130 | 4.24556633187039 |
| 62 | 314.901 | 313.016877418456 | 1.88412258154369 |
| 63 | 309.16 | 312.121207444958 | -2.96120744495772 |
| 64 | 316.15 | 310.806984240338 | 5.34301575966162 |
| 65 | 336.544 | 334.352383770486 | 2.19161622951359 |
| 66 | 339.196 | 338.276518456579 | 0.919481543421384 |
| 67 | 326.738 | 333.137797170882 | -6.39979717088243 |
| 68 | 320.838 | 322.275712771456 | -1.43771277145621 |
| 69 | 318.62 | 315.954694643189 | 2.66530535681088 |
| 70 | 331.533 | 325.817984442324 | 5.71501555767586 |
| 71 | 335.378 | 335.2565781563 | 0.121421843700092 |
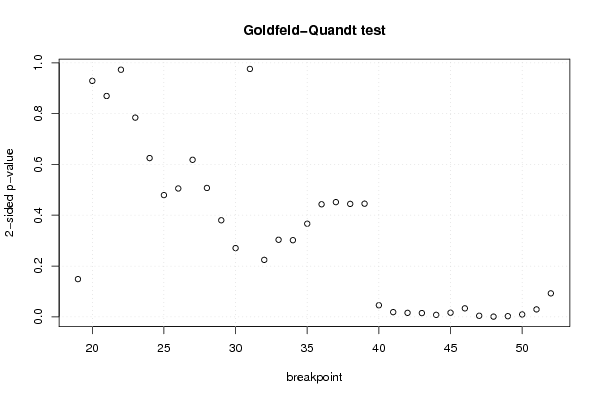
| Goldfeld-Quandt test for Heteroskedasticity | |||
| p-values | Alternative Hypothesis | ||
| breakpoint index | greater | 2-sided | less |
| 19 | 0.074220852144216 | 0.148441704288432 | 0.925779147855784 |
| 20 | 0.464578127209132 | 0.929156254418264 | 0.535421872790868 |
| 21 | 0.565203142099856 | 0.869593715800287 | 0.434796857900144 |
| 22 | 0.486524746415984 | 0.973049492831967 | 0.513475253584016 |
| 23 | 0.392204405870877 | 0.784408811741755 | 0.607795594129123 |
| 24 | 0.312526464953824 | 0.625052929907647 | 0.687473535046176 |
| 25 | 0.239670740316477 | 0.479341480632954 | 0.760329259683523 |
| 26 | 0.252696539562258 | 0.505393079124516 | 0.747303460437742 |
| 27 | 0.309145137621708 | 0.618290275243416 | 0.690854862378292 |
| 28 | 0.253675229982960 | 0.507350459965921 | 0.74632477001704 |
| 29 | 0.190087880912163 | 0.380175761824326 | 0.809912119087837 |
| 30 | 0.135260817610666 | 0.270521635221332 | 0.864739182389334 |
| 31 | 0.488045921370259 | 0.976091842740519 | 0.511954078629741 |
| 32 | 0.887902643416638 | 0.224194713166724 | 0.112097356583362 |
| 33 | 0.848332645666047 | 0.303334708667907 | 0.151667354333953 |
| 34 | 0.849142742425357 | 0.301714515149285 | 0.150857257574643 |
| 35 | 0.8167229195321 | 0.366554160935799 | 0.183277080467900 |
| 36 | 0.778419072512152 | 0.443161854975697 | 0.221580927487848 |
| 37 | 0.774186741795286 | 0.451626516409428 | 0.225813258204714 |
| 38 | 0.777703045058638 | 0.444593909882723 | 0.222296954941362 |
| 39 | 0.7772816479985 | 0.445436704003 | 0.2227183520015 |
| 40 | 0.977263652141724 | 0.0454726957165512 | 0.0227363478582756 |
| 41 | 0.990829605402045 | 0.0183407891959106 | 0.00917039459795532 |
| 42 | 0.992242547639804 | 0.0155149047203924 | 0.00775745236019619 |
| 43 | 0.99267122193836 | 0.0146575561232811 | 0.00732877806164057 |
| 44 | 0.996175937123683 | 0.00764812575263317 | 0.00382406287631659 |
| 45 | 0.99197536721962 | 0.0160492655607603 | 0.00802463278038013 |
| 46 | 0.983378086352252 | 0.0332438272954956 | 0.0166219136477478 |
| 47 | 0.997989294399354 | 0.00402141120129116 | 0.00201070560064558 |
| 48 | 0.999722493768495 | 0.00055501246301022 | 0.00027750623150511 |
| 49 | 0.998793678553814 | 0.00241264289237245 | 0.00120632144618623 |
| 50 | 0.995367767418999 | 0.00926446516200247 | 0.00463223258100123 |
| 51 | 0.985409283929187 | 0.0291814321416255 | 0.0145907160708128 |
| 52 | 0.95386534637526 | 0.0922693072494796 | 0.0461346536247398 |
| Meta Analysis of Goldfeld-Quandt test for Heteroskedasticity | |||
| Description | # significant tests | % significant tests | OK/NOK |
| 1% type I error level | 5 | 0.147058823529412 | NOK |
| 5% type I error level | 12 | 0.352941176470588 | NOK |
| 10% type I error level | 13 | 0.382352941176471 | NOK |