| Multiple Linear Regression - Estimated Regression Equation |
| y[t] = + 18.1864437368423 + 0.206751675048763y1[t] + 0.333777650199015y2[t] + 0.520824147742392y3[t] -0.220361994936251y4[t] -3.29045670333491M1[t] + 4.25600909331611M2[t] -16.8638473658139M3[t] -5.88390147598205M4[t] + 9.7805082769888M5[t] + 19.3620595783345M6[t] -3.81998157203203M7[t] -16.2516899915533M8[t] -8.12360050980905M9[t] + 0.579419546771023M10[t] + 13.5708797465492M11[t] -0.0338081356043498t + e[t] |
| Multiple Linear Regression - Ordinary Least Squares | |||||
| Variable | Parameter | S.D. | T-STAT H0: parameter = 0 | 2-tail p-value | 1-tail p-value |
| (Intercept) | 18.1864437368423 | 11.164053 | 1.629 | 0.109995 | 0.054997 |
| y1 | 0.206751675048763 | 0.142445 | 1.4514 | 0.153298 | 0.076649 |
| y2 | 0.333777650199015 | 0.122211 | 2.7312 | 0.008859 | 0.00443 |
| y3 | 0.520824147742392 | 0.120729 | 4.314 | 8.2e-05 | 4.1e-05 |
| y4 | -0.220361994936251 | 0.140102 | -1.5729 | 0.122458 | 0.061229 |
| M1 | -3.29045670333491 | 3.05909 | -1.0756 | 0.287582 | 0.143791 |
| M2 | 4.25600909331611 | 3.379807 | 1.2592 | 0.21416 | 0.10708 |
| M3 | -16.8638473658139 | 2.998161 | -5.6247 | 1e-06 | 0 |
| M4 | -5.88390147598205 | 5.004684 | -1.1757 | 0.245644 | 0.122822 |
| M5 | 9.7805082769888 | 4.764616 | 2.0527 | 0.045689 | 0.022844 |
| M6 | 19.3620595783345 | 3.800405 | 5.0947 | 6e-06 | 3e-06 |
| M7 | -3.81998157203203 | 3.504889 | -1.0899 | 0.281313 | 0.140657 |
| M8 | -16.2516899915533 | 3.468919 | -4.6849 | 2.4e-05 | 1.2e-05 |
| M9 | -8.12360050980905 | 4.788879 | -1.6963 | 0.096435 | 0.048217 |
| M10 | 0.579419546771023 | 4.623816 | 0.1253 | 0.900811 | 0.450406 |
| M11 | 13.5708797465492 | 3.550863 | 3.8219 | 0.000388 | 0.000194 |
| t | -0.0338081356043498 | 0.031047 | -1.0889 | 0.281733 | 0.140866 |
| Multiple Linear Regression - Regression Statistics | |
| Multiple R | 0.937289648886527 |
| R-squared | 0.878511885909829 |
| Adjusted R-squared | 0.837154230049345 |
| F-TEST (value) | 21.2418201087945 |
| F-TEST (DF numerator) | 16 |
| F-TEST (DF denominator) | 47 |
| p-value | 3.33066907387547e-16 |
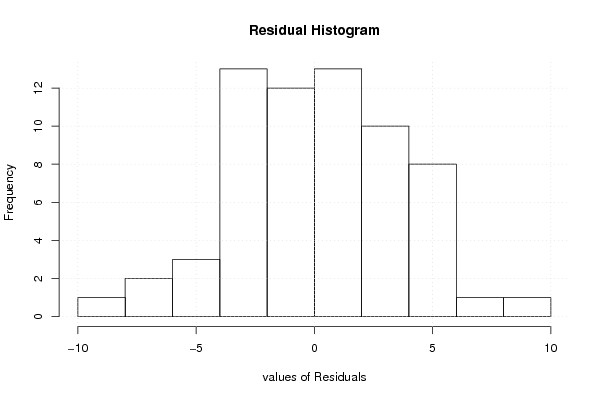
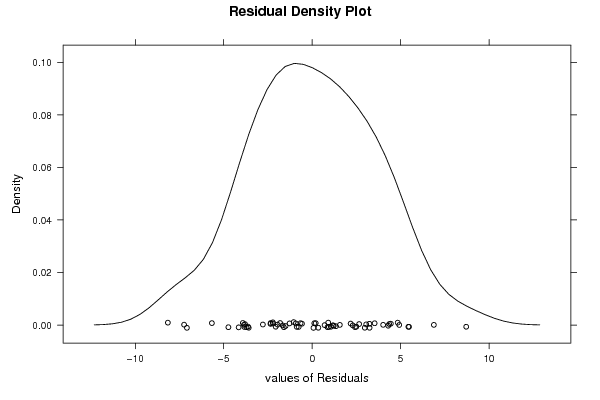
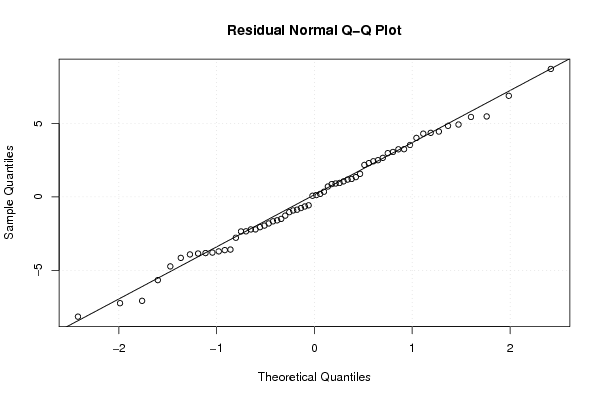
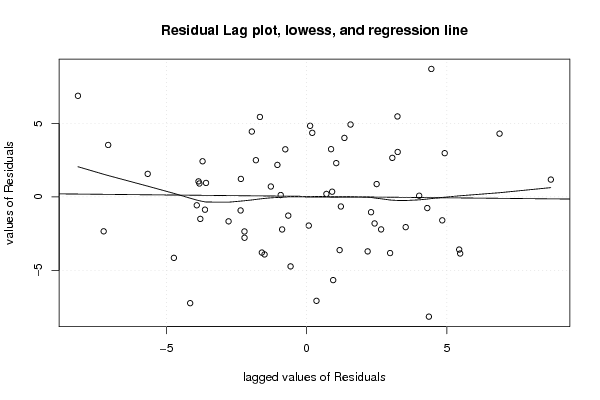
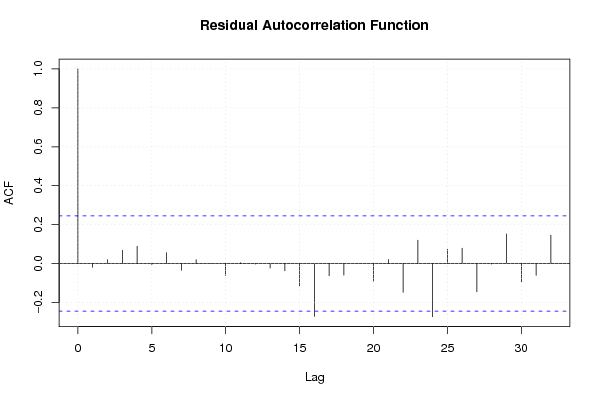
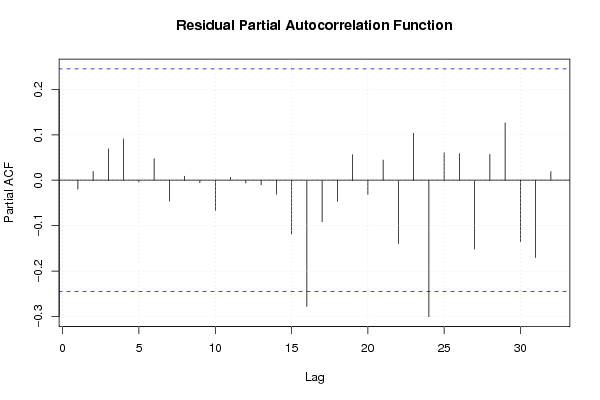
| Multiple Linear Regression - Residual Statistics | |
| Residual Standard Deviation | 4.09930331129844 |
| Sum Squared Residuals | 789.80151898705 |
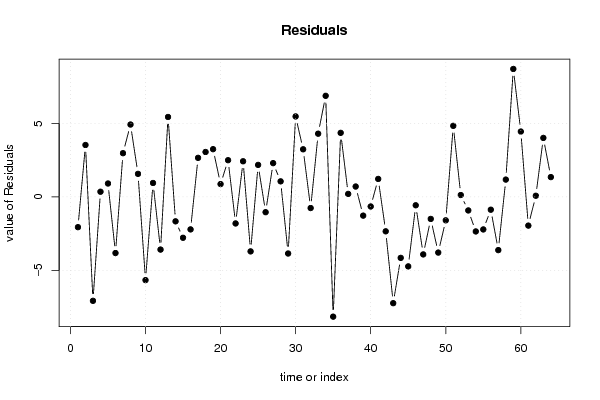
| Multiple Linear Regression - Actuals, Interpolation, and Residuals | |||
| Time or Index | Actuals | Interpolation Forecast | Residuals Prediction Error |
| 1 | 98.1 | 100.163562116279 | -2.0635621162787 |
| 2 | 113.9 | 110.367091275934 | 3.53290872406601 |
| 3 | 80.9 | 87.9825967548852 | -7.08259675488519 |
| 4 | 95.7 | 95.3504304016376 | 0.349569598362421 |
| 5 | 113.2 | 112.291017263688 | 0.908982736311528 |
| 6 | 105.9 | 109.727907570237 | -3.82790757023684 |
| 7 | 108.8 | 105.824023154376 | 2.97597684562353 |
| 8 | 102.3 | 97.3745746708748 | 4.92542532912516 |
| 9 | 99 | 97.434574124871 | 1.56542587512897 |
| 10 | 100.7 | 106.370983383380 | -5.67098338337979 |
| 11 | 115.5 | 114.554240303839 | 0.945759696160877 |
| 12 | 100.7 | 104.290532497281 | -3.5905324972813 |
| 13 | 109.9 | 104.458847725017 | 5.44115227498254 |
| 14 | 114.6 | 116.267293568763 | -1.66729356876312 |
| 15 | 85.4 | 88.186561316945 | -2.78656131694498 |
| 16 | 100.5 | 102.717244799970 | -2.21724479997049 |
| 17 | 114.8 | 112.144032465738 | 2.65596753426219 |
| 18 | 116.5 | 113.444600612403 | 3.05539938759667 |
| 19 | 112.9 | 109.65226445491 | 3.24773554509007 |
| 20 | 102 | 101.130183064126 | 0.869816935874058 |
| 21 | 106 | 103.503496135092 | 2.49650386490848 |
| 22 | 105.3 | 107.111956045829 | -1.81195604582879 |
| 23 | 118.8 | 116.376312509643 | 2.42368749035701 |
| 24 | 106.1 | 109.814370221283 | -3.71437022128312 |
| 25 | 109.3 | 107.124332503747 | 2.17566749625341 |
| 26 | 117.2 | 118.244998758399 | -1.04499875839947 |
| 27 | 92.5 | 90.2034072692194 | 2.29659273078056 |
| 28 | 104.2 | 103.144856694781 | 1.05514330521926 |
| 29 | 112.5 | 116.359497333671 | -3.85949733367101 |
| 30 | 122.4 | 116.923261700412 | 5.47673829958794 |
| 31 | 113.3 | 110.061192297587 | 3.23880770241283 |
| 32 | 100 | 100.763239321996 | -0.763239321995807 |
| 33 | 110.7 | 106.397501277855 | 4.30249872214511 |
| 34 | 112.8 | 105.918629879881 | 6.88137012011918 |
| 35 | 109.8 | 117.960214307733 | -8.1602143077326 |
| 36 | 117.3 | 112.939837379346 | 4.36016262065359 |
| 37 | 109.1 | 108.900734517117 | 0.199265482883037 |
| 38 | 115.9 | 115.196128186663 | 0.703871813336926 |
| 39 | 96 | 97.278665343505 | -1.2786653435051 |
| 40 | 99.8 | 100.456659812106 | -0.65665981210601 |
| 41 | 116.8 | 115.579315118823 | 1.22068488117705 |
| 42 | 115.7 | 118.047329725509 | -2.34732972550937 |
| 43 | 99.4 | 106.642609111021 | -7.24260911102061 |
| 44 | 94.3 | 98.4565197682442 | -4.15651976824419 |
| 45 | 91 | 95.7367313969585 | -4.73673139695853 |
| 46 | 93.2 | 93.7743613604872 | -0.57436136048724 |
| 47 | 103.1 | 107.021098228086 | -3.92109822808631 |
| 48 | 94.1 | 95.6026892459783 | -1.50268924597832 |
| 49 | 91.8 | 95.5950657768933 | -3.79506577689333 |
| 50 | 102.7 | 104.299558407327 | -1.59955840732663 |
| 51 | 82.6 | 77.7627973956157 | 4.83720260438433 |
| 52 | 89.1 | 88.976765283151 | 0.123234716848961 |
| 53 | 104.5 | 105.426137818080 | -0.926137818079758 |
| 54 | 105.1 | 107.456900391438 | -2.3569003914384 |
| 55 | 95.1 | 97.3199109821058 | -2.21991098210582 |
| 56 | 88.7 | 89.5754831747592 | -0.875483174759216 |
| 57 | 86.3 | 89.927697065224 | -3.62769706522403 |
| 58 | 91.8 | 90.6240693304234 | 1.17593066957665 |
| 59 | 111.5 | 102.788134650699 | 8.71186534930103 |
| 60 | 99.7 | 95.2525706561109 | 4.44742934388914 |
| 61 | 97.5 | 99.457457360947 | -1.95745736094696 |
| 62 | 111.7 | 111.624929802914 | 0.0750701970862843 |
| 63 | 86.2 | 82.1859719198296 | 4.01402808017039 |
| 64 | 95.4 | 94.0540430083541 | 1.34595699164586 |
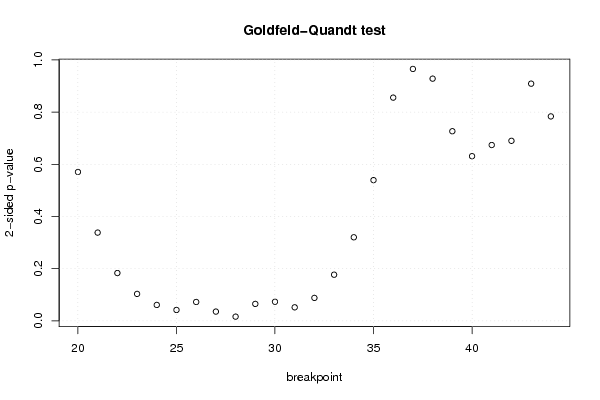
| Goldfeld-Quandt test for Heteroskedasticity | |||
| p-values | Alternative Hypothesis | ||
| breakpoint index | greater | 2-sided | less |
| 20 | 0.285184637111776 | 0.570369274223551 | 0.714815362888224 |
| 21 | 0.168978881867090 | 0.337957763734181 | 0.83102111813291 |
| 22 | 0.0914589573802515 | 0.182917914760503 | 0.908541042619749 |
| 23 | 0.0514654753606256 | 0.102930950721251 | 0.948534524639374 |
| 24 | 0.0303539570935869 | 0.0607079141871738 | 0.969646042906413 |
| 25 | 0.0207334386589061 | 0.0414668773178123 | 0.979266561341094 |
| 26 | 0.0359951900878849 | 0.0719903801757699 | 0.964004809912115 |
| 27 | 0.0175878388488975 | 0.035175677697795 | 0.982412161151103 |
| 28 | 0.00790409483565242 | 0.0158081896713048 | 0.992095905164348 |
| 29 | 0.0323164571157184 | 0.0646329142314367 | 0.967683542884282 |
| 30 | 0.036380123046927 | 0.072760246093854 | 0.963619876953073 |
| 31 | 0.0257828959466976 | 0.0515657918933952 | 0.974217104053302 |
| 32 | 0.0438392193691378 | 0.0876784387382757 | 0.956160780630862 |
| 33 | 0.0882841086440164 | 0.176568217288033 | 0.911715891355984 |
| 34 | 0.160033594215683 | 0.320067188431367 | 0.839966405784317 |
| 35 | 0.269534321020045 | 0.539068642040091 | 0.730465678979955 |
| 36 | 0.572302033380081 | 0.855395933239837 | 0.427697966619919 |
| 37 | 0.517358033644948 | 0.965283932710104 | 0.482641966355052 |
| 38 | 0.464070351146251 | 0.928140702292503 | 0.535929648853749 |
| 39 | 0.363251568012598 | 0.726503136025196 | 0.636748431987402 |
| 40 | 0.315468915218751 | 0.630937830437502 | 0.684531084781249 |
| 41 | 0.336845561348906 | 0.673691122697811 | 0.663154438651094 |
| 42 | 0.344900622286897 | 0.689801244573794 | 0.655099377713103 |
| 43 | 0.454425029763287 | 0.908850059526574 | 0.545574970236713 |
| 44 | 0.391720319338617 | 0.783440638677233 | 0.608279680661383 |
| Meta Analysis of Goldfeld-Quandt test for Heteroskedasticity | |||
| Description | # significant tests | % significant tests | OK/NOK |
| 1% type I error level | 0 | 0 | OK |
| 5% type I error level | 3 | 0.12 | NOK |
| 10% type I error level | 9 | 0.36 | NOK |