| Multiple Linear Regression - Estimated Regression Equation |
| Y[t] = -7.25130954706303 + 4.22226300962114X[t] + 1.04736521388181Y1[t] + 0.0376245976777666Y2[t] -0.097101944440974`Y3 `[t] + 7.17062324388718M1[t] -0.749238461059722M2[t] + 15.3898231371423M3[t] + 62.9135695182735M4[t] + 15.1120552978287M5[t] -10.2916108571521M6[t] -8.7424582977394M7[t] + 0.183702098776305M8[t] + 19.7291850870341M9[t] + 17.4629062366240M10[t] + 4.42028691167321M11[t] + 0.0743693373524595t + e[t] |
| Multiple Linear Regression - Ordinary Least Squares | |||||
| Variable | Parameter | S.D. | T-STAT H0: parameter = 0 | 2-tail p-value | 1-tail p-value |
| (Intercept) | -7.25130954706303 | 19.602198 | -0.3699 | 0.713669 | 0.356834 |
| X | 4.22226300962114 | 2.986362 | 1.4138 | 0.16624 | 0.08312 |
| Y1 | 1.04736521388181 | 0.169151 | 6.1919 | 0 | 0 |
| Y2 | 0.0376245976777666 | 0.244714 | 0.1537 | 0.878691 | 0.439345 |
| `Y3 ` | -0.097101944440974 | 0.170431 | -0.5697 | 0.57249 | 0.286245 |
| M1 | 7.17062324388718 | 5.018126 | 1.4289 | 0.161885 | 0.080943 |
| M2 | -0.749238461059722 | 5.345836 | -0.1402 | 0.889342 | 0.444671 |
| M3 | 15.3898231371423 | 5.081818 | 3.0284 | 0.004595 | 0.002298 |
| M4 | 62.9135695182735 | 5.890239 | 10.681 | 0 | 0 |
| M5 | 15.1120552978287 | 10.689212 | 1.4138 | 0.166264 | 0.083132 |
| M6 | -10.2916108571521 | 8.960191 | -1.1486 | 0.258513 | 0.129257 |
| M7 | -8.7424582977394 | 5.499965 | -1.5895 | 0.12093 | 0.060465 |
| M8 | 0.183702098776305 | 6.832256 | 0.0269 | 0.978702 | 0.489351 |
| M9 | 19.7291850870341 | 6.522285 | 3.0249 | 0.004638 | 0.002319 |
| M10 | 17.4629062366240 | 6.158248 | 2.8357 | 0.007549 | 0.003775 |
| M11 | 4.42028691167321 | 5.260442 | 0.8403 | 0.406451 | 0.203225 |
| t | 0.0743693373524595 | 0.075044 | 0.991 | 0.328483 | 0.164241 |
| Multiple Linear Regression - Regression Statistics | |
| Multiple R | 0.987452102306002 |
| R-squared | 0.975061654348542 |
| Adjusted R-squared | 0.963661267765018 |
| F-TEST (value) | 85.5288237117979 |
| F-TEST (DF numerator) | 16 |
| F-TEST (DF denominator) | 35 |
| p-value | 0 |
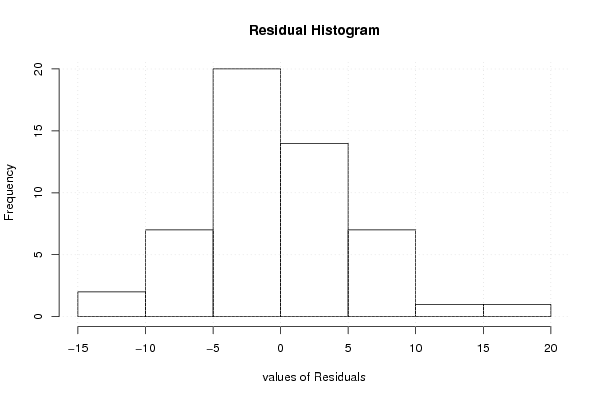
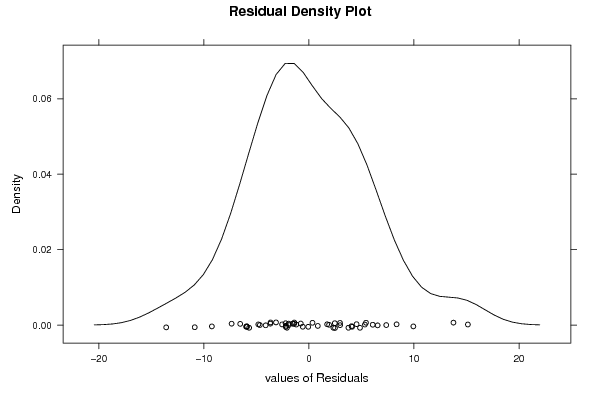
| Multiple Linear Regression - Residual Statistics | |
| Residual Standard Deviation | 6.92125470629104 |
| Sum Squared Residuals | 1676.63183482746 |
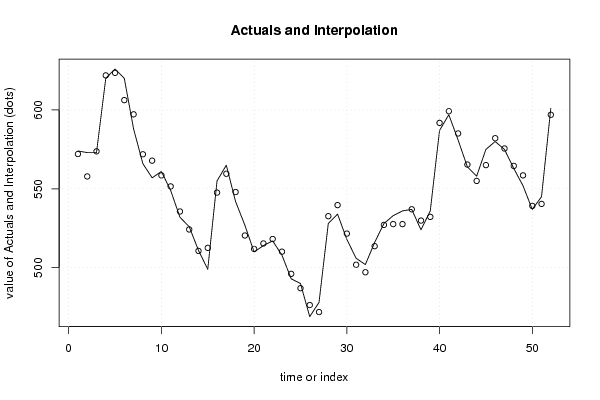
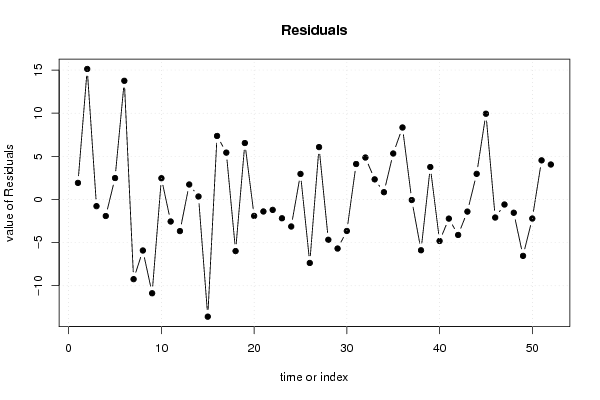
| Multiple Linear Regression - Actuals, Interpolation, and Residuals | |||
| Time or Index | Actuals | Interpolation Forecast | Residuals Prediction Error |
| 1 | 574 | 572.082566662012 | 1.91743333798777 |
| 2 | 573 | 557.867942867672 | 15.1320571323275 |
| 3 | 573 | 573.779280447688 | -0.77928044768837 |
| 4 | 620 | 621.92238323514 | -1.92238323514000 |
| 5 | 626 | 623.518505348934 | 2.48149465106607 |
| 6 | 620 | 606.241755905451 | 13.7582440945486 |
| 7 | 588 | 597.243042716267 | -9.24304271626653 |
| 8 | 566 | 571.919526353204 | -5.91952635320427 |
| 9 | 557 | 567.875968514372 | -10.8759685143719 |
| 10 | 561 | 558.537293149578 | 2.46270685042177 |
| 11 | 549 | 551.556125416109 | -2.55612541610872 |
| 12 | 532 | 535.666241165886 | -3.66624116588603 |
| 13 | 526 | 524.266122161238 | 1.73387783876224 |
| 14 | 511 | 510.662043683122 | 0.337956316877916 |
| 15 | 499 | 512.589981879879 | -13.5899818798793 |
| 16 | 555 | 547.637957733261 | 7.36204226673934 |
| 17 | 565 | 559.568298822031 | 5.43170117796879 |
| 18 | 542 | 547.984854946468 | -5.98485494646756 |
| 19 | 527 | 520.457514012034 | 6.54248598796583 |
| 20 | 510 | 511.911180346677 | -1.91118034667679 |
| 21 | 514 | 515.394799793272 | -1.39479979327210 |
| 22 | 517 | 518.209262141834 | -1.20926214183427 |
| 23 | 508 | 510.184339242089 | -2.18433924208904 |
| 24 | 493 | 496.136600758101 | -3.13660075810136 |
| 25 | 490 | 487.041187918691 | 2.95881208130901 |
| 26 | 469 | 476.363148444253 | -7.36314844425336 |
| 27 | 478 | 471.925565261871 | 6.07443473812894 |
| 28 | 528 | 532.673420197002 | -4.67342019700206 |
| 29 | 534 | 539.692298220361 | -5.69229822036074 |
| 30 | 518 | 521.654505069943 | -3.65450506994278 |
| 31 | 506 | 501.890833908617 | 4.10916609138315 |
| 32 | 502 | 497.138375846413 | 4.86162415358684 |
| 33 | 516 | 513.670903255419 | 2.32909674458147 |
| 34 | 528 | 527.156831679287 | 0.843168320713138 |
| 35 | 533 | 527.672116403523 | 5.32788359647704 |
| 36 | 536 | 527.655092848571 | 8.34490715142917 |
| 37 | 537 | 537.065080726553 | -0.0650807265530644 |
| 38 | 524 | 529.894317643669 | -5.89431764366887 |
| 39 | 536 | 532.238319563115 | 3.76168043688542 |
| 40 | 587 | 591.818596133928 | -4.81859613392812 |
| 41 | 597 | 599.220897608674 | -2.22089760867411 |
| 42 | 581 | 585.118884078138 | -4.11888407813825 |
| 43 | 564 | 565.408609363082 | -1.40860936308243 |
| 44 | 558 | 555.030917453706 | 2.96908254629422 |
| 45 | 575 | 565.058328436937 | 9.94167156306247 |
| 46 | 580 | 582.096613029301 | -2.09661302930064 |
| 47 | 575 | 575.587418938279 | -0.587418938279294 |
| 48 | 563 | 564.542065227442 | -1.54206522744174 |
| 49 | 552 | 558.545042531506 | -6.54504253150593 |
| 50 | 537 | 539.212547361283 | -2.21254736128322 |
| 51 | 545 | 540.466852847447 | 4.53314715255329 |
| 52 | 601 | 596.947642700669 | 4.05235729933083 |
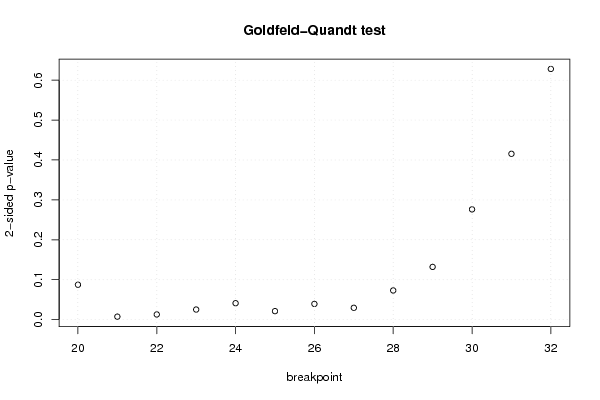
| Goldfeld-Quandt test for Heteroskedasticity | |||
| p-values | Alternative Hypothesis | ||
| breakpoint index | greater | 2-sided | less |
| 20 | 0.956330770933257 | 0.0873384581334854 | 0.0436692290667427 |
| 21 | 0.996317324578664 | 0.00736535084267278 | 0.00368267542133639 |
| 22 | 0.993552714938964 | 0.0128945701220718 | 0.00644728506103589 |
| 23 | 0.98741118580943 | 0.0251776283811384 | 0.0125888141905692 |
| 24 | 0.979474381605975 | 0.0410512367880499 | 0.0205256183940249 |
| 25 | 0.989398352495594 | 0.021203295008811 | 0.0106016475044055 |
| 26 | 0.98033815608643 | 0.039323687827139 | 0.0196618439135695 |
| 27 | 0.985228023842031 | 0.0295439523159373 | 0.0147719761579686 |
| 28 | 0.96349817863096 | 0.07300364273808 | 0.03650182136904 |
| 29 | 0.933973318022266 | 0.132053363955467 | 0.0660266819777336 |
| 30 | 0.861857782708721 | 0.276284434582558 | 0.138142217291279 |
| 31 | 0.79225713927304 | 0.415485721453919 | 0.207742860726960 |
| 32 | 0.685933354529191 | 0.628133290941618 | 0.314066645470809 |
| Meta Analysis of Goldfeld-Quandt test for Heteroskedasticity | |||
| Description | # significant tests | % significant tests | OK/NOK |
| 1% type I error level | 1 | 0.0769230769230769 | NOK |
| 5% type I error level | 7 | 0.538461538461538 | NOK |
| 10% type I error level | 9 | 0.692307692307692 | NOK |