| Multiple Linear Regression - Estimated Regression Equation |
| Tarweprijs[t] = + 246.070714285714 -14.5294523809523M1[t] -4.55276190476188M2[t] -2.39007142857144M3[t] -16.1333809523809M4[t] -18.5126904761905M5[t] -14.264M6[t] -11.9333095238095M7[t] -2.94061904761904M8[t] + 6.00607142857145M9[t] -3.71188095238094M10[t] -8.32719047619046M11[t] + 0.125309523809523t + e[t] |
| Multiple Linear Regression - Ordinary Least Squares | |||||
| Variable | Parameter | S.D. | T-STAT H0: parameter = 0 | 2-tail p-value | 1-tail p-value |
| (Intercept) | 246.070714285714 | 41.948476 | 5.866 | 1e-06 | 0 |
| M1 | -14.5294523809523 | 50.67244 | -0.2867 | 0.775663 | 0.387831 |
| M2 | -4.55276190476188 | 50.639039 | -0.0899 | 0.92877 | 0.464385 |
| M3 | -2.39007142857144 | 50.613044 | -0.0472 | 0.96255 | 0.481275 |
| M4 | -16.1333809523809 | 50.594468 | -0.3189 | 0.751329 | 0.375665 |
| M5 | -18.5126904761905 | 50.58332 | -0.366 | 0.716131 | 0.358065 |
| M6 | -14.264 | 50.579603 | -0.282 | 0.779257 | 0.389629 |
| M7 | -11.9333095238095 | 50.58332 | -0.2359 | 0.814594 | 0.407297 |
| M8 | -2.94061904761904 | 50.594468 | -0.0581 | 0.953915 | 0.476958 |
| M9 | 6.00607142857145 | 50.613044 | 0.1187 | 0.90608 | 0.45304 |
| M10 | -3.71188095238094 | 53.329686 | -0.0696 | 0.944825 | 0.472413 |
| M11 | -8.32719047619046 | 53.319109 | -0.1562 | 0.876608 | 0.438304 |
| t | 0.125309523809523 | 0.613187 | 0.2044 | 0.839016 | 0.419508 |
| Multiple Linear Regression - Regression Statistics | |
| Multiple R | 0.115070824238089 |
| R-squared | 0.0132412945908331 |
| Adjusted R-squared | -0.255874715975303 |
| F-TEST (value) | 0.0492029239099433 |
| F-TEST (DF numerator) | 12 |
| F-TEST (DF denominator) | 44 |
| p-value | 0.99999874385495 |
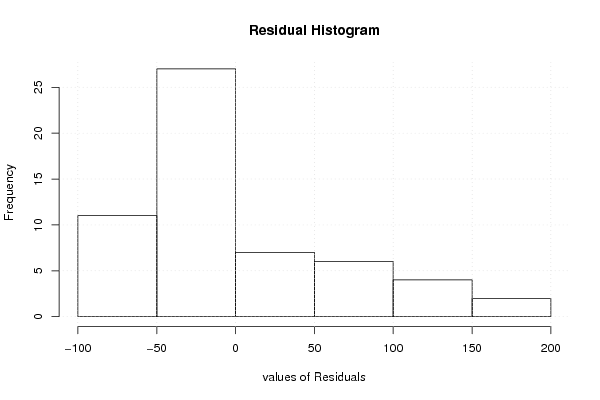
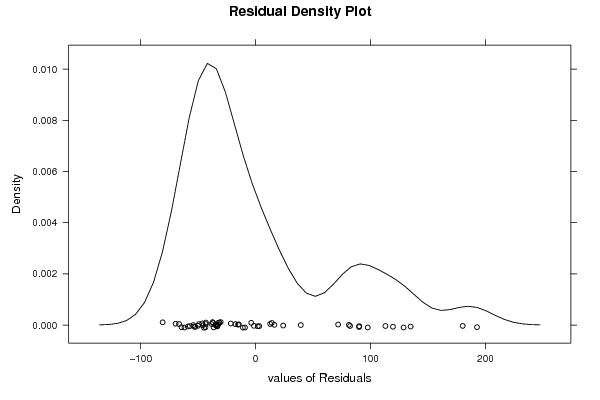
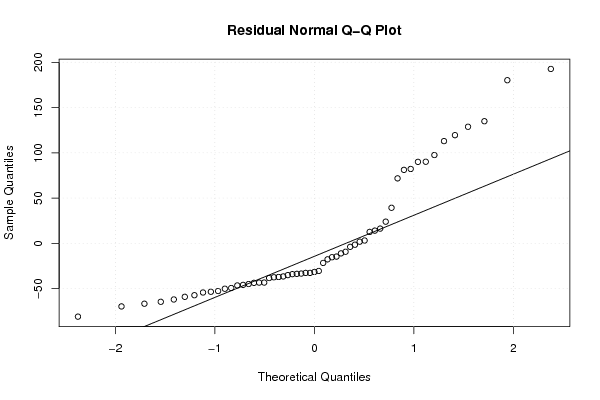
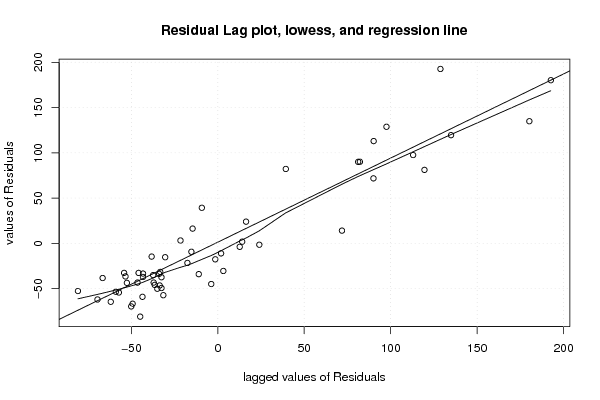
| Multiple Linear Regression - Residual Statistics | |
| Residual Standard Deviation | 75.3996204688767 |
| Sum Squared Residuals | 250144.521741429 |
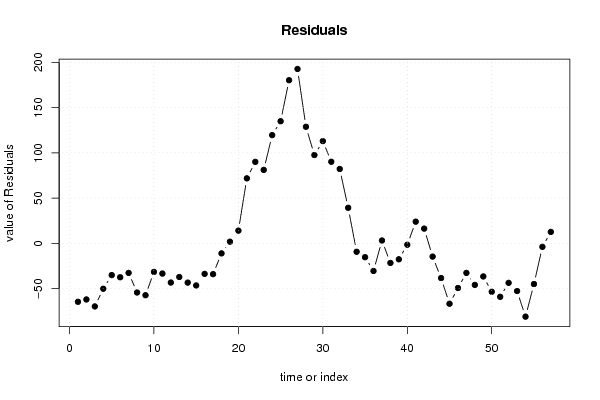
| Multiple Linear Regression - Actuals, Interpolation, and Residuals | |||
| Time or Index | Actuals | Interpolation Forecast | Residuals Prediction Error |
| 1 | 167.16 | 231.666571428571 | -64.5065714285712 |
| 2 | 179.84 | 241.768571428571 | -61.9285714285715 |
| 3 | 174.44 | 244.056571428571 | -69.6165714285714 |
| 4 | 180.35 | 230.438571428571 | -50.0885714285714 |
| 5 | 193.17 | 228.184571428571 | -35.0145714285715 |
| 6 | 195.16 | 232.558571428571 | -37.3985714285715 |
| 7 | 202.43 | 235.014571428571 | -32.5845714285714 |
| 8 | 189.91 | 244.132571428571 | -54.2225714285715 |
| 9 | 195.98 | 253.204571428571 | -57.2245714285714 |
| 10 | 212.09 | 243.611928571429 | -31.5219285714286 |
| 11 | 205.81 | 239.121928571429 | -33.3119285714286 |
| 12 | 204.31 | 247.574428571429 | -43.2644285714286 |
| 13 | 196.07 | 233.170285714286 | -37.1002857142858 |
| 14 | 199.98 | 243.272285714286 | -43.2922857142857 |
| 15 | 199.1 | 245.560285714286 | -46.4602857142857 |
| 16 | 198.31 | 231.942285714286 | -33.6322857142857 |
| 17 | 195.72 | 229.688285714286 | -33.9682857142857 |
| 18 | 223.04 | 234.062285714286 | -11.0222857142857 |
| 19 | 238.41 | 236.518285714286 | 1.89171428571427 |
| 20 | 259.73 | 245.636285714286 | 14.0937142857143 |
| 21 | 326.54 | 254.708285714286 | 71.8317142857143 |
| 22 | 335.15 | 245.115642857143 | 90.0343571428571 |
| 23 | 321.81 | 240.625642857143 | 81.1843571428572 |
| 24 | 368.62 | 249.078142857143 | 119.541857142857 |
| 25 | 369.59 | 234.674 | 134.916 |
| 26 | 425 | 244.776 | 180.224 |
| 27 | 439.72 | 247.064 | 192.656 |
| 28 | 362.23 | 233.446 | 128.784 |
| 29 | 328.76 | 231.192 | 97.568 |
| 30 | 348.55 | 235.566 | 112.984 |
| 31 | 328.18 | 238.022 | 90.158 |
| 32 | 329.34 | 247.14 | 82.2 |
| 33 | 295.55 | 256.212 | 39.338 |
| 34 | 237.38 | 246.619357142857 | -9.23935714285715 |
| 35 | 226.85 | 242.129357142857 | -15.2793571428571 |
| 36 | 220.14 | 250.581857142857 | -30.4418571428571 |
| 37 | 239.36 | 236.177714285714 | 3.1822857142857 |
| 38 | 224.69 | 246.279714285714 | -21.5897142857143 |
| 39 | 230.98 | 248.567714285714 | -17.5877142857143 |
| 40 | 233.47 | 234.949714285714 | -1.47971428571428 |
| 41 | 256.7 | 232.695714285714 | 24.0042857142857 |
| 42 | 253.41 | 237.069714285714 | 16.3402857142857 |
| 43 | 224.95 | 239.525714285714 | -14.5757142857143 |
| 44 | 210.37 | 248.643714285714 | -38.2737142857143 |
| 45 | 191.09 | 257.715714285714 | -66.6257142857143 |
| 46 | 198.85 | 248.123071428571 | -49.2730714285714 |
| 47 | 211.04 | 243.633071428571 | -32.5930714285714 |
| 48 | 206.25 | 252.085571428571 | -45.8355714285714 |
| 49 | 201.19 | 237.681428571429 | -36.4914285714286 |
| 50 | 194.37 | 247.783428571429 | -53.4134285714286 |
| 51 | 191.08 | 250.071428571429 | -58.9914285714285 |
| 52 | 192.87 | 236.453428571429 | -43.5834285714286 |
| 53 | 181.61 | 234.199428571429 | -52.5894285714285 |
| 54 | 157.67 | 238.573428571429 | -80.9034285714286 |
| 55 | 196.14 | 241.029428571429 | -44.8894285714286 |
| 56 | 246.35 | 250.147428571429 | -3.79742857142858 |
| 57 | 271.9 | 259.219428571429 | 12.6805714285714 |
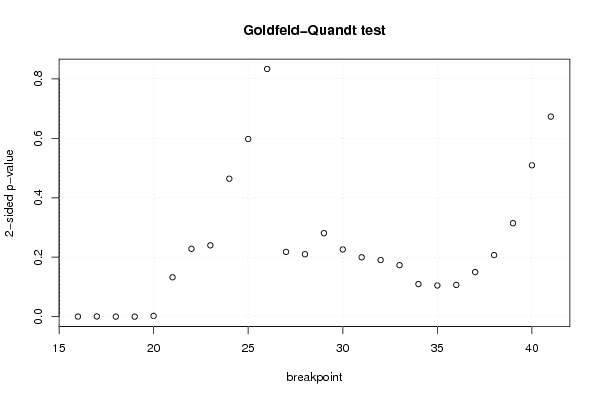
| Goldfeld-Quandt test for Heteroskedasticity | |||
| p-values | Alternative Hypothesis | ||
| breakpoint index | greater | 2-sided | less |
| 16 | 0.00022876016240949 | 0.00045752032481898 | 0.99977123983759 |
| 17 | 0.00044313196577878 | 0.00088626393155756 | 0.999556868034221 |
| 18 | 9.80847139554618e-05 | 0.000196169427910924 | 0.999901915286045 |
| 19 | 5.23562646792467e-05 | 0.000104712529358493 | 0.99994764373532 |
| 20 | 0.00136974153351684 | 0.00273948306703369 | 0.998630258466483 |
| 21 | 0.0662554735314624 | 0.132510947062925 | 0.933744526468538 |
| 22 | 0.114132126736021 | 0.228264253472043 | 0.885867873263979 |
| 23 | 0.12002708677003 | 0.24005417354006 | 0.87997291322997 |
| 24 | 0.232016922365438 | 0.464033844730876 | 0.767983077634562 |
| 25 | 0.298802332372312 | 0.597604664744624 | 0.701197667627688 |
| 26 | 0.58334066997409 | 0.833318660051821 | 0.416659330025911 |
| 27 | 0.891038044764429 | 0.217923910471142 | 0.108961955235571 |
| 28 | 0.894935958232893 | 0.210128083534215 | 0.105064041767107 |
| 29 | 0.859554488099745 | 0.28089102380051 | 0.140445511900255 |
| 30 | 0.88686892939257 | 0.226262141214857 | 0.113131070607429 |
| 31 | 0.900146051367485 | 0.199707897265029 | 0.0998539486325146 |
| 32 | 0.904745939952958 | 0.190508120094083 | 0.0952540600470416 |
| 33 | 0.913390029726315 | 0.173219940547371 | 0.0866099702736853 |
| 34 | 0.945155638999747 | 0.109688722000506 | 0.054844361000253 |
| 35 | 0.947474606529203 | 0.105050786941593 | 0.0525253934707965 |
| 36 | 0.946588747709606 | 0.106822504580788 | 0.053411252290394 |
| 37 | 0.925089720960622 | 0.149820558078757 | 0.0749102790393784 |
| 38 | 0.896389487851172 | 0.207221024297656 | 0.103610512148828 |
| 39 | 0.842742311523967 | 0.314515376952065 | 0.157257688476033 |
| 40 | 0.745379320679044 | 0.509241358641912 | 0.254620679320956 |
| 41 | 0.663553631326233 | 0.672892737347534 | 0.336446368673767 |
| Meta Analysis of Goldfeld-Quandt test for Heteroskedasticity | |||
| Description | # significant tests | % significant tests | OK/NOK |
| 1% type I error level | 5 | 0.192307692307692 | NOK |
| 5% type I error level | 5 | 0.192307692307692 | NOK |
| 10% type I error level | 5 | 0.192307692307692 | NOK |