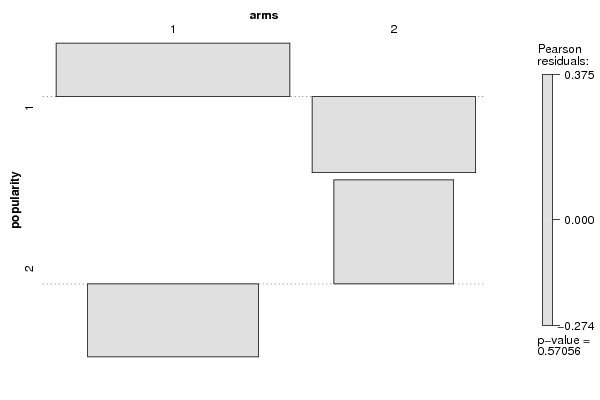
| Tabulation of Results | ||
| popularity x arms | ||
| 1 | 2 | 1 | 68 | 31 | 2 | 34 | 19 |
| Tabulation of Expected Results | ||
| popularity x arms | ||
| 1 | 2 | 1 | 66.43 | 32.57 | 2 | 35.57 | 17.43 |
| Statistical Results | |
| Pearson's Chi-squared test with Yates' continuity correction | |
| Chi Square Statistic | 0.15 |
| Degrees of Freedom | 1 |
| P value | 0.7 |