| Multiple Linear Regression - Estimated Regression Equation |
| PrijsCacao[t] = + 1384.86440476191 + 62.0890992063496M1[t] + 65.1430793650795M2[t] + 5.70305952380944M3[t] + 26.8870396825396M4[t] -0.89698015873049M5[t] + 74.6190000000001M6[t] + 87.6409801587303M7[t] -42.1950396825399M8[t] -108.993059523809M9[t] -101.926460317460M10[t] -160.92198015873M11[t] + 35.1680198412698t + e[t] |
| Multiple Linear Regression - Ordinary Least Squares | |||||
| Variable | Parameter | S.D. | T-STAT H0: parameter = 0 | 2-tail p-value | 1-tail p-value |
| (Intercept) | 1384.86440476191 | 141.256226 | 9.8039 | 0 | 0 |
| M1 | 62.0890992063496 | 170.633079 | 0.3639 | 0.717694 | 0.358847 |
| M2 | 65.1430793650795 | 170.520603 | 0.382 | 0.704282 | 0.352141 |
| M3 | 5.70305952380944 | 170.43307 | 0.0335 | 0.973457 | 0.486729 |
| M4 | 26.8870396825396 | 170.370519 | 0.1578 | 0.875325 | 0.437662 |
| M5 | -0.89698015873049 | 170.332977 | -0.0053 | 0.995822 | 0.497911 |
| M6 | 74.6190000000001 | 170.320461 | 0.4381 | 0.66345 | 0.331725 |
| M7 | 87.6409801587303 | 170.332977 | 0.5145 | 0.609458 | 0.304729 |
| M8 | -42.1950396825399 | 170.370519 | -0.2477 | 0.805545 | 0.402772 |
| M9 | -108.993059523809 | 170.43307 | -0.6395 | 0.525809 | 0.262905 |
| M10 | -101.926460317460 | 179.581019 | -0.5676 | 0.573206 | 0.286603 |
| M11 | -160.92198015873 | 179.545404 | -0.8963 | 0.374984 | 0.187492 |
| t | 35.1680198412698 | 2.064832 | 17.0319 | 0 | 0 |
| Multiple Linear Regression - Regression Statistics | |
| Multiple R | 0.933280547277717 |
| R-squared | 0.871012579926995 |
| Adjusted R-squared | 0.835834192634357 |
| F-TEST (value) | 24.7598780660784 |
| F-TEST (DF numerator) | 12 |
| F-TEST (DF denominator) | 44 |
| p-value | 1.11022302462516e-15 |
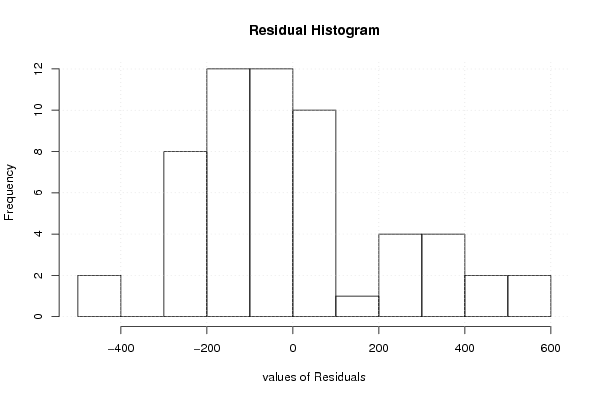
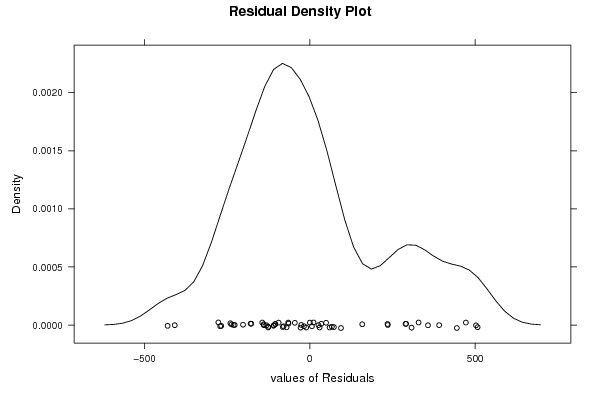
| Multiple Linear Regression - Residual Statistics | |
| Residual Standard Deviation | 253.898753064943 |
| Sum Squared Residuals | 2836441.37954905 |
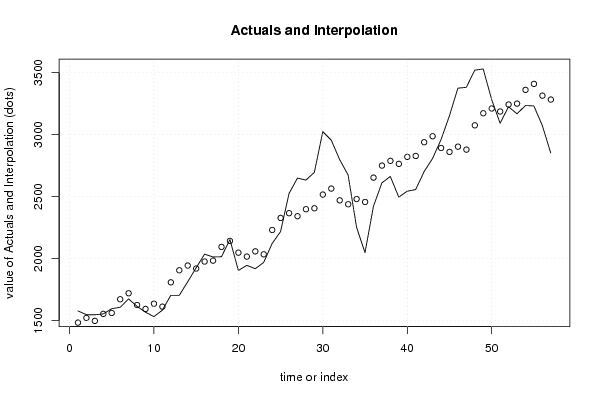
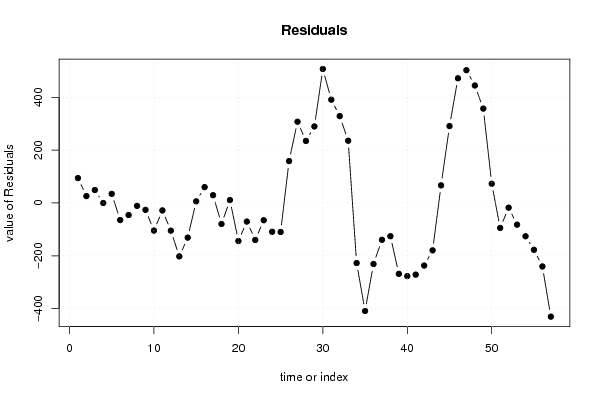
| Multiple Linear Regression - Actuals, Interpolation, and Residuals | |||
| Time or Index | Actuals | Interpolation Forecast | Residuals Prediction Error |
| 1 | 1576.23 | 1482.12152380952 | 94.1084761904785 |
| 2 | 1546.37 | 1520.34352380952 | 26.0264761904762 |
| 3 | 1545.05 | 1496.07152380952 | 48.9784761904758 |
| 4 | 1552.34 | 1552.42352380952 | -0.0835238095243298 |
| 5 | 1594.3 | 1559.80752380952 | 34.4924761904758 |
| 6 | 1605.78 | 1670.49152380952 | -64.7115238095235 |
| 7 | 1673.21 | 1718.68152380952 | -45.471523809524 |
| 8 | 1612.94 | 1624.01352380952 | -11.0735238095240 |
| 9 | 1566.34 | 1592.38352380952 | -26.0435238095238 |
| 10 | 1530.17 | 1634.61814285714 | -104.448142857143 |
| 11 | 1582.54 | 1610.79064285714 | -28.2506428571428 |
| 12 | 1702.16 | 1806.88064285714 | -104.720642857143 |
| 13 | 1701.93 | 1904.13776190476 | -202.207761904763 |
| 14 | 1811.15 | 1942.35976190476 | -131.209761904762 |
| 15 | 1924.2 | 1918.08776190476 | 6.11223809523815 |
| 16 | 2034.25 | 1974.43976190476 | 59.8102380952381 |
| 17 | 2011.13 | 1981.82376190476 | 29.3062380952381 |
| 18 | 2013.04 | 2092.50776190476 | -79.4677619047621 |
| 19 | 2151.67 | 2140.69776190476 | 10.9722380952381 |
| 20 | 1902.09 | 2046.02976190476 | -143.939761904762 |
| 21 | 1944.01 | 2014.39976190476 | -70.3897619047622 |
| 22 | 1916.67 | 2056.63438095238 | -139.964380952381 |
| 23 | 1967.31 | 2032.80688095238 | -65.496880952381 |
| 24 | 2119.88 | 2228.89688095238 | -109.016880952381 |
| 25 | 2216.38 | 2326.154 | -109.774000000000 |
| 26 | 2522.83 | 2364.376 | 158.454 |
| 27 | 2647.64 | 2340.104 | 307.536 |
| 28 | 2631.23 | 2396.456 | 234.774 |
| 29 | 2693.41 | 2403.84 | 289.57 |
| 30 | 3021.76 | 2514.524 | 507.236 |
| 31 | 2953.67 | 2562.714 | 390.956 |
| 32 | 2796.8 | 2468.046 | 328.754000000000 |
| 33 | 2672.05 | 2436.416 | 235.634 |
| 34 | 2251.23 | 2478.65061904762 | -227.420619047619 |
| 35 | 2046.08 | 2454.82311904762 | -408.743119047619 |
| 36 | 2420.04 | 2650.91311904762 | -230.873119047619 |
| 37 | 2608.89 | 2748.17023809524 | -139.280238095239 |
| 38 | 2660.47 | 2786.39223809524 | -125.922238095238 |
| 39 | 2493.98 | 2762.12023809524 | -268.140238095238 |
| 40 | 2541.7 | 2818.47223809524 | -276.772238095238 |
| 41 | 2554.6 | 2825.85623809524 | -271.256238095238 |
| 42 | 2699.61 | 2936.54023809524 | -236.930238095238 |
| 43 | 2805.48 | 2984.73023809524 | -179.250238095238 |
| 44 | 2956.66 | 2890.06223809524 | 66.597761904762 |
| 45 | 3149.51 | 2858.43223809524 | 291.077761904762 |
| 46 | 3372.5 | 2900.66685714286 | 471.833142857143 |
| 47 | 3379.33 | 2876.83935714286 | 502.490642857143 |
| 48 | 3517.54 | 3072.92935714286 | 444.610642857143 |
| 49 | 3527.34 | 3170.18647619048 | 357.153523809523 |
| 50 | 3281.06 | 3208.40847619048 | 72.6515238095239 |
| 51 | 3089.65 | 3184.13647619048 | -94.486476190476 |
| 52 | 3222.76 | 3240.48847619048 | -17.7284761904757 |
| 53 | 3165.76 | 3247.87247619048 | -82.1124761904755 |
| 54 | 3232.43 | 3358.55647619048 | -126.126476190476 |
| 55 | 3229.54 | 3406.74647619048 | -177.206476190476 |
| 56 | 3071.74 | 3312.07847619048 | -240.338476190477 |
| 57 | 2850.17 | 3280.44847619048 | -430.278476190476 |
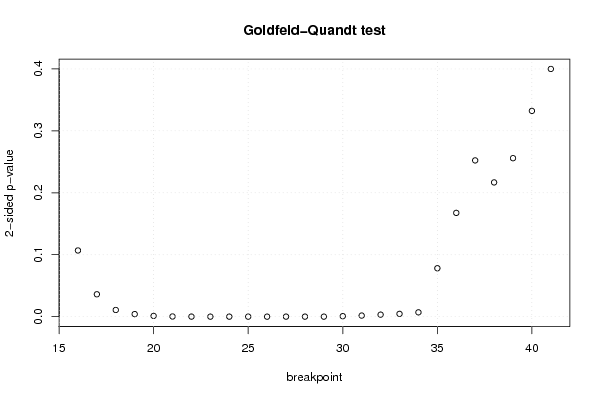
| Goldfeld-Quandt test for Heteroskedasticity | |||
| p-values | Alternative Hypothesis | ||
| breakpoint index | greater | 2-sided | less |
| 16 | 0.0534408628463813 | 0.106881725692763 | 0.946559137153619 |
| 17 | 0.0180730556149191 | 0.0361461112298383 | 0.98192694438508 |
| 18 | 0.00539897911882325 | 0.0107979582376465 | 0.994601020881177 |
| 19 | 0.00207034874621668 | 0.00414069749243336 | 0.997929651253783 |
| 20 | 0.000620827484517941 | 0.00124165496903588 | 0.999379172515482 |
| 21 | 0.000149768377125842 | 0.000299536754251683 | 0.999850231622874 |
| 22 | 3.77219869932395e-05 | 7.5443973986479e-05 | 0.999962278013007 |
| 23 | 8.29500279427866e-06 | 1.65900055885573e-05 | 0.999991704997206 |
| 24 | 2.14612819336265e-06 | 4.29225638672529e-06 | 0.999997853871807 |
| 25 | 5.16074589248048e-07 | 1.03214917849610e-06 | 0.99999948392541 |
| 26 | 3.73500236851257e-06 | 7.47000473702514e-06 | 0.999996264997632 |
| 27 | 1.54093603165815e-05 | 3.0818720633163e-05 | 0.999984590639683 |
| 28 | 1.04637407524590e-05 | 2.09274815049180e-05 | 0.999989536259247 |
| 29 | 1.02893830125257e-05 | 2.05787660250513e-05 | 0.999989710616987 |
| 30 | 0.000380295971627725 | 0.00076059194325545 | 0.999619704028372 |
| 31 | 0.000873736243283737 | 0.00174747248656747 | 0.999126263756716 |
| 32 | 0.0016161393165666 | 0.0032322786331332 | 0.998383860683433 |
| 33 | 0.00226565900434571 | 0.00453131800869141 | 0.997734340995654 |
| 34 | 0.00349041694675453 | 0.00698083389350905 | 0.996509583053246 |
| 35 | 0.0390729983308826 | 0.0781459966617652 | 0.960927001669117 |
| 36 | 0.08376744741804 | 0.167534894836080 | 0.91623255258196 |
| 37 | 0.126150256245002 | 0.252300512490005 | 0.873849743754998 |
| 38 | 0.10837779145557 | 0.21675558291114 | 0.89162220854443 |
| 39 | 0.127956232954975 | 0.25591246590995 | 0.872043767045025 |
| 40 | 0.166109992062036 | 0.332219984124071 | 0.833890007937964 |
| 41 | 0.199979676821416 | 0.399959353642832 | 0.800020323178584 |
| Meta Analysis of Goldfeld-Quandt test for Heteroskedasticity | |||
| Description | # significant tests | % significant tests | OK/NOK |
| 1% type I error level | 16 | 0.615384615384615 | NOK |
| 5% type I error level | 18 | 0.692307692307692 | NOK |
| 10% type I error level | 19 | 0.730769230769231 | NOK |