| Coefficients of Bias-Reduced Logistic Regression | ||||
| Variable | Parameter | S.E. | t-stat | 2-sided p-value |
| (Intercept) | 0.100083458556983 | 0.459406084706927 | 0.217854011709117 | 0.829993459583843 |
| P | -9.69818565716094 | 19.0505846595736 | -0.509075486682624 | 0.616883014777494 |
| Summary of Bias-Reduced Logistic Regression | |
| Deviance | 26.8624330217688 |
| Penalized deviance | 31.1621774354272 |
| Residual Degrees of Freedom | 18 |
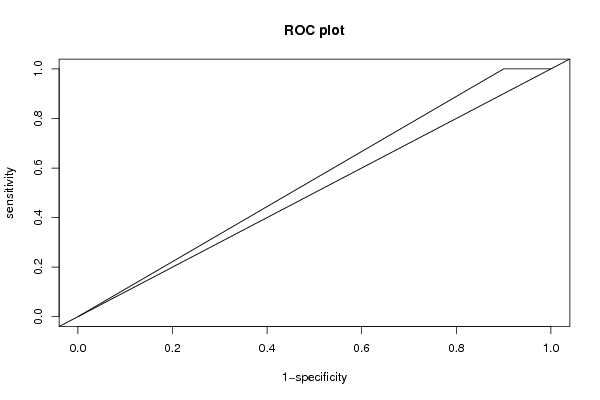
| ROC Area | 0.55 |
| Hosmer–Lemeshow test | |
| Chi-square | NA |
| Degrees of Freedom | NA |
| P(>Chi) | NA |
| Fit of Logistic Regression | |||
| Index | Actual | Fitted | Error |
| 1 | 0 | 0.525 | -0.525 |
| 2 | 0 | 0.525 | -0.525 |
| 3 | 0 | 0.525 | -0.525 |
| 4 | 0 | 0.525 | -0.525 |
| 5 | 0 | 0.525 | -0.525 |
| 6 | 0 | 0.525 | -0.525 |
| 7 | 0 | 0.25 | -0.25 |
| 8 | 0 | 0.525 | -0.525 |
| 9 | 0 | 0.525 | -0.525 |
| 10 | 0 | 0.525 | -0.525 |
| 11 | 1 | 0.525 | 0.475 |
| 12 | 1 | 0.525 | 0.475 |
| 13 | 1 | 0.525 | 0.475 |
| 14 | 1 | 0.525 | 0.475 |
| 15 | 1 | 0.525 | 0.475 |
| 16 | 1 | 0.525 | 0.475 |
| 17 | 1 | 0.525 | 0.475 |
| 18 | 1 | 0.525 | 0.475 |
| 19 | 1 | 0.525 | 0.475 |
| 20 | 1 | 0.525 | 0.475 |
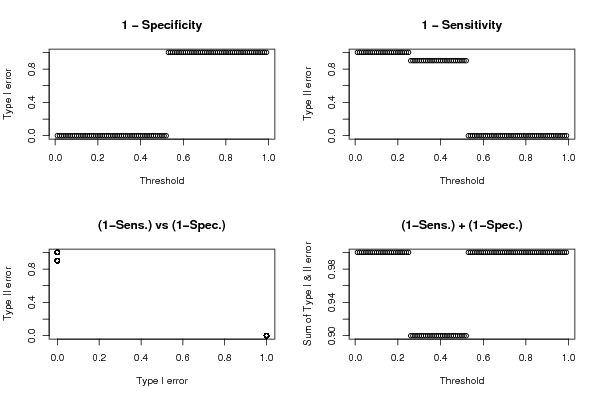
| Type I & II errors for various threshold values | ||
| Threshold | Type I | Type II |
| 0.01 | 0 | 1 |
| 0.02 | 0 | 1 |
| 0.03 | 0 | 1 |
| 0.04 | 0 | 1 |
| 0.05 | 0 | 1 |
| 0.06 | 0 | 1 |
| 0.07 | 0 | 1 |
| 0.08 | 0 | 1 |
| 0.09 | 0 | 1 |
| 0.1 | 0 | 1 |
| 0.11 | 0 | 1 |
| 0.12 | 0 | 1 |
| 0.13 | 0 | 1 |
| 0.14 | 0 | 1 |
| 0.15 | 0 | 1 |
| 0.16 | 0 | 1 |
| 0.17 | 0 | 1 |
| 0.18 | 0 | 1 |
| 0.19 | 0 | 1 |
| 0.2 | 0 | 1 |
| 0.21 | 0 | 1 |
| 0.22 | 0 | 1 |
| 0.23 | 0 | 1 |
| 0.24 | 0 | 1 |
| 0.25 | 0 | 1 |
| 0.26 | 0 | 0.9 |
| 0.27 | 0 | 0.9 |
| 0.28 | 0 | 0.9 |
| 0.29 | 0 | 0.9 |
| 0.3 | 0 | 0.9 |
| 0.31 | 0 | 0.9 |
| 0.32 | 0 | 0.9 |
| 0.33 | 0 | 0.9 |
| 0.34 | 0 | 0.9 |
| 0.35 | 0 | 0.9 |
| 0.36 | 0 | 0.9 |
| 0.37 | 0 | 0.9 |
| 0.38 | 0 | 0.9 |
| 0.39 | 0 | 0.9 |
| 0.4 | 0 | 0.9 |
| 0.41 | 0 | 0.9 |
| 0.42 | 0 | 0.9 |
| 0.43 | 0 | 0.9 |
| 0.44 | 0 | 0.9 |
| 0.45 | 0 | 0.9 |
| 0.46 | 0 | 0.9 |
| 0.47 | 0 | 0.9 |
| 0.48 | 0 | 0.9 |
| 0.49 | 0 | 0.9 |
| 0.5 | 0 | 0.9 |
| 0.51 | 0 | 0.9 |
| 0.52 | 0 | 0.9 |
| 0.53 | 1 | 0 |
| 0.54 | 1 | 0 |
| 0.55 | 1 | 0 |
| 0.56 | 1 | 0 |
| 0.57 | 1 | 0 |
| 0.58 | 1 | 0 |
| 0.59 | 1 | 0 |
| 0.6 | 1 | 0 |
| 0.61 | 1 | 0 |
| 0.62 | 1 | 0 |
| 0.63 | 1 | 0 |
| 0.64 | 1 | 0 |
| 0.65 | 1 | 0 |
| 0.66 | 1 | 0 |
| 0.67 | 1 | 0 |
| 0.68 | 1 | 0 |
| 0.69 | 1 | 0 |
| 0.7 | 1 | 0 |
| 0.71 | 1 | 0 |
| 0.72 | 1 | 0 |
| 0.73 | 1 | 0 |
| 0.74 | 1 | 0 |
| 0.75 | 1 | 0 |
| 0.76 | 1 | 0 |
| 0.77 | 1 | 0 |
| 0.78 | 1 | 0 |
| 0.79 | 1 | 0 |
| 0.8 | 1 | 0 |
| 0.81 | 1 | 0 |
| 0.82 | 1 | 0 |
| 0.83 | 1 | 0 |
| 0.84 | 1 | 0 |
| 0.85 | 1 | 0 |
| 0.86 | 1 | 0 |
| 0.87 | 1 | 0 |
| 0.88 | 1 | 0 |
| 0.89 | 1 | 0 |
| 0.9 | 1 | 0 |
| 0.91 | 1 | 0 |
| 0.92 | 1 | 0 |
| 0.93 | 1 | 0 |
| 0.94 | 1 | 0 |
| 0.95 | 1 | 0 |
| 0.96 | 1 | 0 |
| 0.97 | 1 | 0 |
| 0.98 | 1 | 0 |
| 0.99 | 1 | 0 |