| Tabulation of Results | ||
| gender x depression | ||
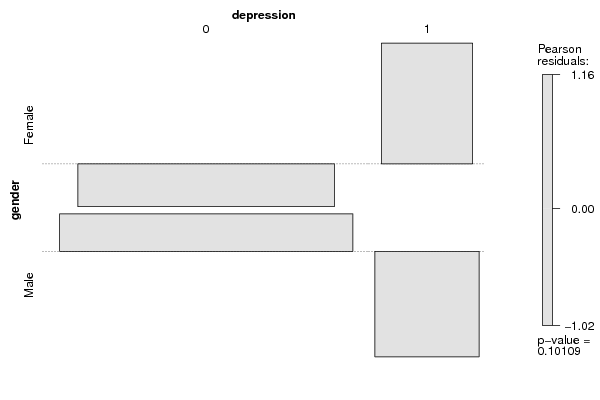
| 0 | 1 | Female | 52 | 10 | Male | 75 | 6 |
| Tabulation of Expected Results | ||
| gender x depression | ||
| 0 | 1 | Female | 55.06 | 6.94 | Male | 71.94 | 9.06 |
| Statistical Results | |
| Pearson's Chi-squared test with simulated p-value (based on 2000 replicates) | |
| Exact Pearson Chi Square Statistic | 2.69 |
| P value | 0.11 |