| Tabulation of Results | ||
| Connected x Happiness | ||
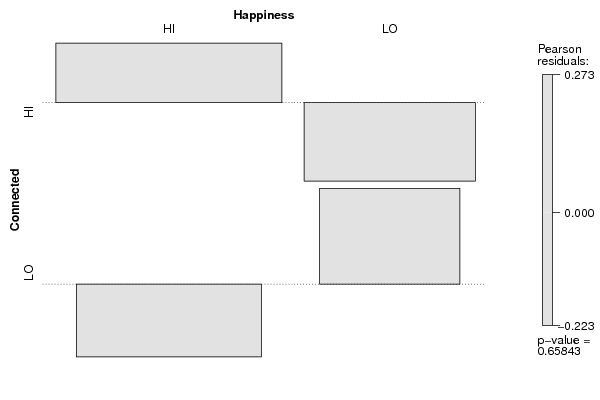
| HI | LO | HI | 63 | 34 | LO | 40 | 25 |
| Tabulation of Expected Results | ||
| Connected x Happiness | ||
| HI | LO | HI | 61.67 | 35.33 | LO | 41.33 | 23.67 |
| Statistical Results | |
| Pearson's Chi-squared test with Yates' continuity correction | |
| Pearson Chi Square Statistic | 0.08 |
| Degrees of Freedom | 1 |
| P value | 0.78 |