| Tabulation of Results | ||
| Seperate x Happiness | ||
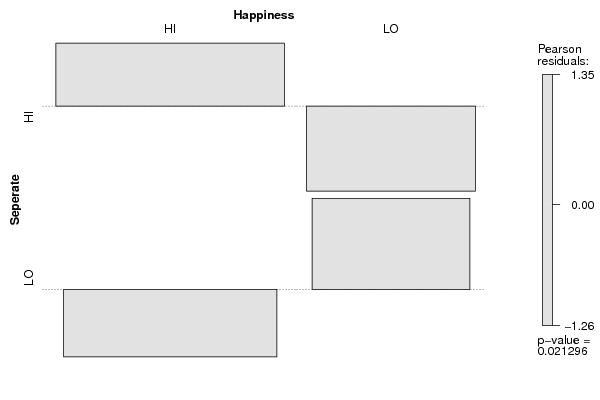
| HI | LO | HI | 46 | 16 | LO | 29 | 25 |
| Tabulation of Expected Results | ||
| Seperate x Happiness | ||
| HI | LO | HI | 40.09 | 21.91 | LO | 34.91 | 19.09 |
| Statistical Results | |
| Pearson's Chi-squared test with Yates' continuity correction | |
| Pearson Chi Square Statistic | 4.44 |
| Degrees of Freedom | 1 |
| P value | 0.04 |