| Tabulation of Results | |||
| Connected x Learning | |||
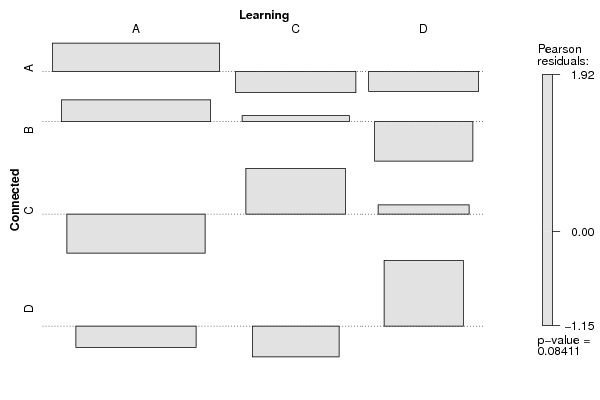
| A | C | D | A | 32 | 12 | 10 | B | 25 | 12 | 6 | C | 14 | 14 | 9 | D | 12 | 5 | 11 |
| Tabulation of Expected Results | |||
| Connected x Learning | |||
| A | C | D | A | 27.67 | 14.33 | 12 | B | 22.03 | 11.41 | 9.56 | C | 18.96 | 9.82 | 8.22 | D | 14.35 | 7.43 | 6.22 |
| Statistical Results | |
| Pearson's Chi-squared test | |
| Pearson Chi Square Statistic | 11.14 |
| Degrees of Freedom | 6 |
| P value | 0.08 |