| Multiple Linear Regression - Estimated Regression Equation |
| vrijetijdsbesteding[t] = + 29.7574433780093 + 0.117381875008497bios[t] + 0.351226236672808schouwburg[t] + 0.441727025825751eedagsacttractie[t] -0.18690047239566huurDVD[t] + e[t] |
| Multiple Linear Regression - Ordinary Least Squares | |||||
| Variable | Parameter | S.D. | T-STAT H0: parameter = 0 | 2-tail p-value | 1-tail p-value |
| (Intercept) | 29.7574433780093 | 15.839775 | 1.8787 | 0.065797 | 0.032898 |
| bios | 0.117381875008497 | 0.043112 | 2.7227 | 0.008746 | 0.004373 |
| schouwburg | 0.351226236672808 | 0.032757 | 10.7221 | 0 | 0 |
| eedagsacttractie | 0.441727025825751 | 0.048367 | 9.1328 | 0 | 0 |
| huurDVD | -0.18690047239566 | 0.192568 | -0.9706 | 0.336171 | 0.168085 |
| Multiple Linear Regression - Regression Statistics | |
| Multiple R | 0.993690183423486 |
| R-squared | 0.987420180632202 |
| Adjusted R-squared | 0.986470760302557 |
| F-TEST (value) | 1040.02426512322 |
| F-TEST (DF numerator) | 4 |
| F-TEST (DF denominator) | 53 |
| p-value | 0 |
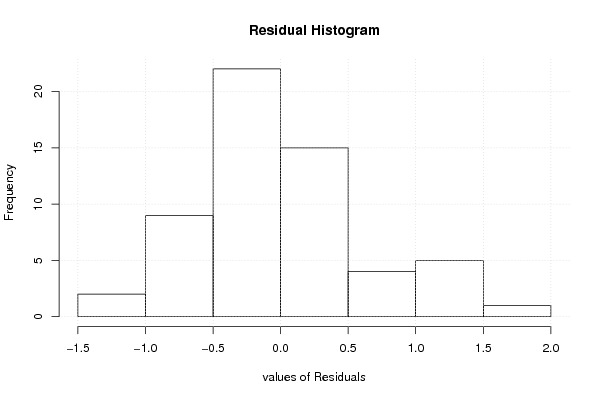
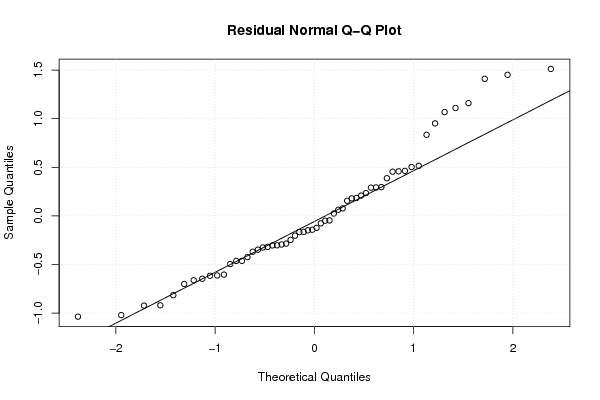
| Multiple Linear Regression - Residual Statistics | |
| Residual Standard Deviation | 0.648444676422851 |
| Sum Squared Residuals | 22.2854664142002 |
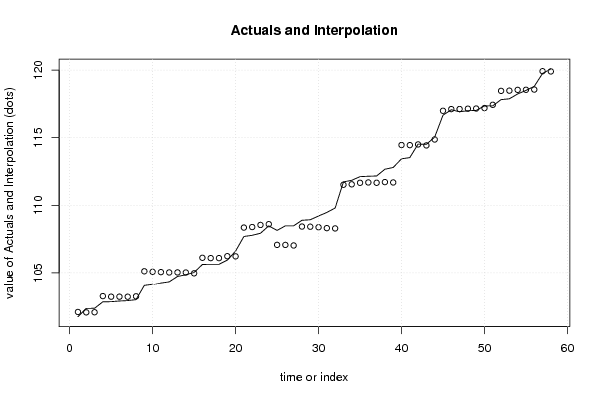
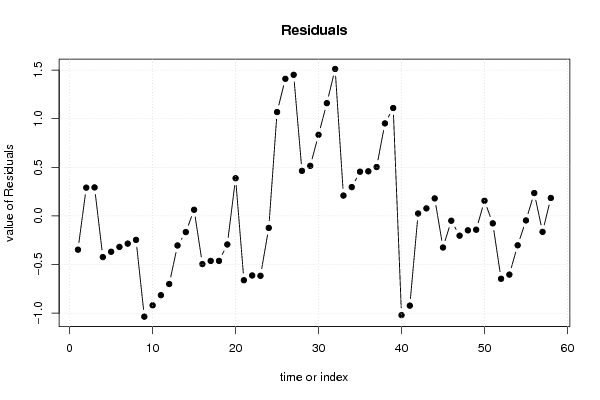
| Multiple Linear Regression - Actuals, Interpolation, and Residuals | |||
| Time or Index | Actuals | Interpolation Forecast | Residuals Prediction Error |
| 1 | 101.76 | 102.106779395192 | -0.346779395192159 |
| 2 | 102.37 | 102.079131904347 | 0.290868095652856 |
| 3 | 102.38 | 102.086607923243 | 0.293392076757025 |
| 4 | 102.86 | 103.283178536288 | -0.423178536287848 |
| 5 | 102.87 | 103.238322422913 | -0.368322422912886 |
| 6 | 102.92 | 103.238322422913 | -0.318322422912889 |
| 7 | 102.95 | 103.234584413465 | -0.284584413464973 |
| 8 | 103.02 | 103.266357493772 | -0.246357493772242 |
| 9 | 104.08 | 105.115676503395 | -1.03567650339517 |
| 10 | 104.16 | 105.079037121271 | -0.919037121270802 |
| 11 | 104.24 | 105.054740059859 | -0.814740059859369 |
| 12 | 104.33 | 105.029929917998 | -0.699929917997644 |
| 13 | 104.73 | 105.033442180364 | -0.303442180364368 |
| 14 | 104.86 | 105.025966161469 | -0.165966161468548 |
| 15 | 105.03 | 104.966385642206 | 0.0636143577935821 |
| 16 | 105.62 | 106.114875909353 | -0.494875909353371 |
| 17 | 105.63 | 106.092447852666 | -0.462447852665902 |
| 18 | 105.63 | 106.092447852666 | -0.462447852665902 |
| 19 | 105.94 | 106.233306102676 | -0.293306102676097 |
| 20 | 106.61 | 106.222092074332 | 0.387907925667645 |
| 21 | 107.69 | 108.350974562732 | -0.660974562731947 |
| 22 | 107.78 | 108.392058218985 | -0.612058218984917 |
| 23 | 107.93 | 108.545316606349 | -0.615316606349354 |
| 24 | 108.48 | 108.602833725104 | -0.122833725103521 |
| 25 | 108.14 | 107.07148733321 | 1.06851266678992 |
| 26 | 108.48 | 107.069618328486 | 1.41038167151388 |
| 27 | 108.48 | 107.028500224559 | 1.45149977544093 |
| 28 | 108.89 | 108.426428115087 | 0.463571884913104 |
| 29 | 108.93 | 108.414689927586 | 0.515310072413961 |
| 30 | 109.21 | 108.375440828383 | 0.834559171617035 |
| 31 | 109.47 | 108.310025663044 | 1.15997433695552 |
| 32 | 109.8 | 108.288258344657 | 1.5117416553432 |
| 33 | 111.73 | 111.520461984212 | 0.2095380157881 |
| 34 | 111.85 | 111.553339987921 | 0.296660012078889 |
| 35 | 112.12 | 111.664852769179 | 0.455147230820827 |
| 36 | 112.15 | 111.691064361695 | 0.458935638304538 |
| 37 | 112.17 | 111.666767300284 | 0.503232699715969 |
| 38 | 112.67 | 111.718153245709 | 0.951846754290785 |
| 39 | 112.8 | 111.69011817485 | 1.10988182515013 |
| 40 | 113.44 | 114.459746626777 | -1.01974662677732 |
| 41 | 113.53 | 114.452270607881 | -0.922270607881493 |
| 42 | 114.53 | 114.505092451635 | 0.024907548364684 |
| 43 | 114.51 | 114.432201267401 | 0.077798732598993 |
| 44 | 115.05 | 114.869648081168 | 0.180351918831711 |
| 45 | 116.67 | 116.994545333775 | -0.324545333775096 |
| 46 | 117.07 | 117.119240513553 | -0.0492405135529805 |
| 47 | 116.92 | 117.122978523001 | -0.202978523000887 |
| 48 | 117 | 117.147674243134 | -0.147674243133568 |
| 49 | 117.02 | 117.161760068135 | -0.141760068134593 |
| 50 | 117.35 | 117.193931807163 | 0.156068192836897 |
| 51 | 117.36 | 117.436036208487 | -0.0760362084868231 |
| 52 | 117.82 | 118.465953115525 | -0.645953115525015 |
| 53 | 117.88 | 118.483298317198 | -0.60329831719773 |
| 54 | 118.24 | 118.541772701504 | -0.301772701504322 |
| 55 | 118.5 | 118.545989343728 | -0.045989343728444 |
| 56 | 118.8 | 118.564679390968 | 0.235320609031988 |
| 57 | 119.76 | 119.923924926892 | -0.163924926891774 |
| 58 | 120.09 | 119.905234879652 | 0.184765120347789 |
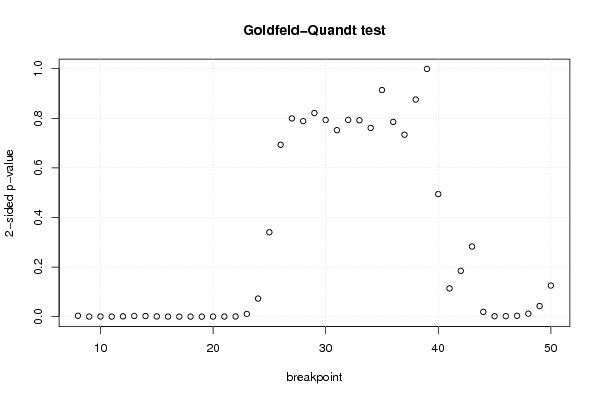
| Goldfeld-Quandt test for Heteroskedasticity | |||
| p-values | Alternative Hypothesis | ||
| breakpoint index | greater | 2-sided | less |
| 8 | 0.00184034838672652 | 0.00368069677345305 | 0.998159651613273 |
| 9 | 0.000187694040226674 | 0.000375388080453348 | 0.999812305959773 |
| 10 | 0.000372581020962747 | 0.000745162041925494 | 0.999627418979037 |
| 11 | 8.97282530086277e-05 | 0.000179456506017255 | 0.999910271746991 |
| 12 | 0.000669564714480161 | 0.00133912942896032 | 0.99933043528552 |
| 13 | 0.00140872422841541 | 0.00281744845683083 | 0.998591275771585 |
| 14 | 0.00124058724437391 | 0.00248117448874781 | 0.998759412755626 |
| 15 | 0.000417881197798382 | 0.000835762395596765 | 0.999582118802202 |
| 16 | 0.000215916530309414 | 0.000431833060618827 | 0.999784083469691 |
| 17 | 0.000100450269110664 | 0.000200900538221327 | 0.999899549730889 |
| 18 | 5.1389604324615e-05 | 0.00010277920864923 | 0.999948610395675 |
| 19 | 3.29743811755183e-05 | 6.59487623510367e-05 | 0.999967025618824 |
| 20 | 0.000209410436185638 | 0.000418820872371276 | 0.999790589563814 |
| 21 | 0.000244261959229608 | 0.000488523918459217 | 0.99975573804077 |
| 22 | 0.000419927170896224 | 0.000839854341792447 | 0.999580072829104 |
| 23 | 0.00540555550562096 | 0.0108111110112419 | 0.994594444494379 |
| 24 | 0.0364336350994514 | 0.0728672701989029 | 0.963566364900549 |
| 25 | 0.170177259192681 | 0.340354518385363 | 0.829822740807319 |
| 26 | 0.346611281342391 | 0.693222562684783 | 0.653388718657609 |
| 27 | 0.399731459413721 | 0.799462918827442 | 0.600268540586279 |
| 28 | 0.394334477466879 | 0.788668954933759 | 0.605665522533121 |
| 29 | 0.410548387124342 | 0.821096774248685 | 0.589451612875658 |
| 30 | 0.396575172443724 | 0.793150344887448 | 0.603424827556276 |
| 31 | 0.376141823080489 | 0.752283646160977 | 0.623858176919511 |
| 32 | 0.39673979206537 | 0.793479584130739 | 0.60326020793463 |
| 33 | 0.396005612691469 | 0.792011225382939 | 0.603994387308531 |
| 34 | 0.380560637764071 | 0.761121275528141 | 0.619439362235929 |
| 35 | 0.543071386043639 | 0.913857227912722 | 0.456928613956361 |
| 36 | 0.607294301812106 | 0.785411396375789 | 0.392705698187895 |
| 37 | 0.633148381395984 | 0.733703237208031 | 0.366851618604016 |
| 38 | 0.562193503825172 | 0.875612992349657 | 0.437806496174828 |
| 39 | 0.49947374656096 | 0.998947493121921 | 0.50052625343904 |
| 40 | 0.752887814175189 | 0.494224371649622 | 0.247112185824811 |
| 41 | 0.943062814722108 | 0.113874370555784 | 0.0569371852778919 |
| 42 | 0.907556447360911 | 0.184887105278178 | 0.092443552639089 |
| 43 | 0.858582444495327 | 0.282835111009346 | 0.141417555504673 |
| 44 | 0.990349141838077 | 0.0193017163238453 | 0.00965085816192266 |
| 45 | 0.999085886674351 | 0.00182822665129852 | 0.000914113325649258 |
| 46 | 0.998988969128568 | 0.00202206174286458 | 0.00101103087143229 |
| 47 | 0.998241481276371 | 0.00351703744725854 | 0.00175851872362927 |
| 48 | 0.994026628272751 | 0.011946743454498 | 0.00597337172724902 |
| 49 | 0.978614513476347 | 0.0427709730473062 | 0.0213854865236531 |
| 50 | 0.937217346682038 | 0.125565306635925 | 0.0627826533179623 |
| Meta Analysis of Goldfeld-Quandt test for Heteroskedasticity | |||
| Description | # significant tests | % significant tests | OK/NOK |
| 1% type I error level | 18 | 0.418604651162791 | NOK |
| 5% type I error level | 22 | 0.511627906976744 | NOK |
| 10% type I error level | 23 | 0.534883720930233 | NOK |