| Multiple Linear Regression - Estimated Regression Equation |
| Cultuuruitgaven[t] = + 61.3522977549417 + 0.1048602621734Bioscoop[t] + 0.167292816816152Schouwburgabonnement[t] + 0.121128872847211Daguitstap[t] + 0.178769949566188t + e[t] |
| Multiple Linear Regression - Ordinary Least Squares | |||||
| Variable | Parameter | S.D. | T-STAT H0: parameter = 0 | 2-tail p-value | 1-tail p-value |
| (Intercept) | 61.3522977549417 | 3.419552 | 17.9416 | 0 | 0 |
| Bioscoop | 0.1048602621734 | 0.017876 | 5.866 | 0 | 0 |
| Schouwburgabonnement | 0.167292816816152 | 0.018921 | 8.8416 | 0 | 0 |
| Daguitstap | 0.121128872847211 | 0.031641 | 3.8282 | 0.000343 | 0.000171 |
| t | 0.178769949566188 | 0.012691 | 14.0861 | 0 | 0 |
| Multiple Linear Regression - Regression Statistics | |
| Multiple R | 0.998649583453835 |
| R-squared | 0.997300990532518 |
| Adjusted R-squared | 0.997097291704784 |
| F-TEST (value) | 4895.95841873238 |
| F-TEST (DF numerator) | 4 |
| F-TEST (DF denominator) | 53 |
| p-value | 0 |
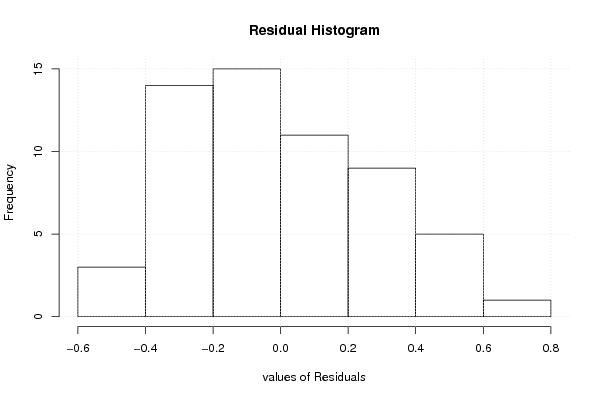
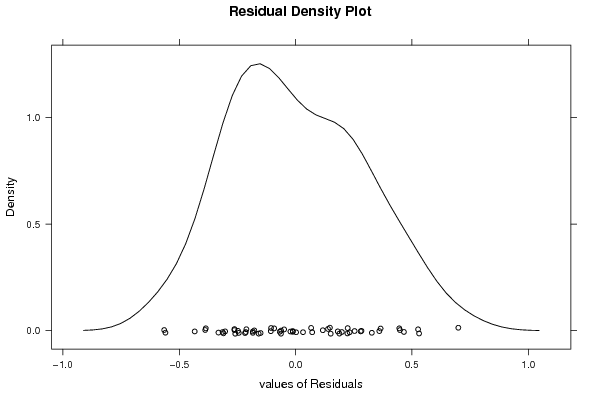
| Multiple Linear Regression - Residual Statistics | |
| Residual Standard Deviation | 0.300357119404695 |
| Sum Squared Residuals | 4.78136315638555 |
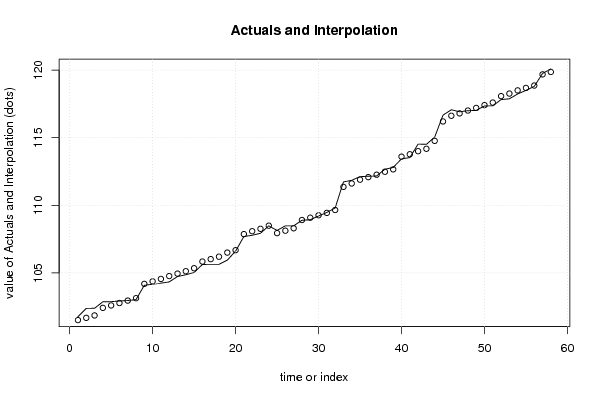
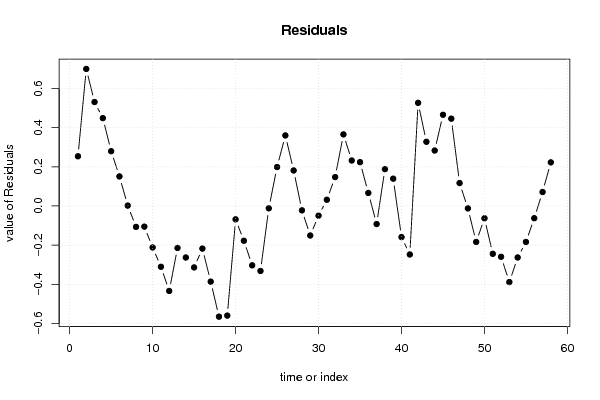
| Multiple Linear Regression - Actuals, Interpolation, and Residuals | |||
| Time or Index | Actuals | Interpolation Forecast | Residuals Prediction Error |
| 1 | 101.76 | 101.506446920734 | 0.253553079266254 |
| 2 | 102.37 | 101.670536433596 | 0.699463566404471 |
| 3 | 102.38 | 101.849306383162 | 0.530693616838279 |
| 4 | 102.86 | 102.411640916719 | 0.448359083280549 |
| 5 | 102.87 | 102.590410866286 | 0.279589133714366 |
| 6 | 102.92 | 102.769180815852 | 0.150819184148176 |
| 7 | 102.95 | 102.947950765418 | 0.00204923458198926 |
| 8 | 103.02 | 103.126720714984 | -0.106720714984205 |
| 9 | 104.08 | 104.185450881003 | -0.105450881003347 |
| 10 | 104.16 | 104.371561048922 | -0.211561048921674 |
| 11 | 104.24 | 104.550330998488 | -0.310330998487864 |
| 12 | 104.33 | 104.763704834571 | -0.43370483457127 |
| 13 | 104.73 | 104.944147712306 | -0.214147712305614 |
| 14 | 104.86 | 105.122917661872 | -0.262917661871806 |
| 15 | 105.03 | 105.343631716307 | -0.313631716307352 |
| 16 | 105.62 | 105.837336735276 | -0.217336735276287 |
| 17 | 105.63 | 106.016106684842 | -0.386106684842484 |
| 18 | 105.63 | 106.194876634409 | -0.564876634408672 |
| 19 | 105.94 | 106.499478898583 | -0.559478898582937 |
| 20 | 106.61 | 106.678248848149 | -0.0682488481491229 |
| 21 | 107.69 | 107.867467411285 | -0.17746741128487 |
| 22 | 107.78 | 108.082938452612 | -0.302938452611743 |
| 23 | 107.93 | 108.261708402178 | -0.331708402177925 |
| 24 | 108.48 | 108.491859880209 | -0.0118598802090825 |
| 25 | 108.14 | 107.941233148457 | 0.198766851543148 |
| 26 | 108.48 | 108.120003098023 | 0.359996901976964 |
| 27 | 108.48 | 108.298773047589 | 0.181226952410776 |
| 28 | 108.89 | 108.912307079956 | -0.022307079956265 |
| 29 | 108.93 | 109.080591003305 | -0.150591003305106 |
| 30 | 109.21 | 109.259360952871 | -0.0493609528713065 |
| 31 | 109.47 | 109.438130902437 | 0.031869097562511 |
| 32 | 109.8 | 109.652553341143 | 0.147446658857366 |
| 33 | 111.73 | 111.364622407162 | 0.365377592838493 |
| 34 | 111.85 | 111.617843142871 | 0.232156857129183 |
| 35 | 112.12 | 111.896230341502 | 0.223769658498275 |
| 36 | 112.15 | 112.083389112042 | 0.0666108879582168 |
| 37 | 112.17 | 112.262159061608 | -0.0921590616079748 |
| 38 | 112.67 | 112.481824513422 | 0.188175486578212 |
| 39 | 112.8 | 112.660594462988 | 0.13940553701202 |
| 40 | 113.44 | 113.598842445306 | -0.158842445306181 |
| 41 | 113.53 | 113.777612394872 | -0.247612394872365 |
| 42 | 114.53 | 114.003569462417 | 0.526430537583418 |
| 43 | 114.51 | 114.182339411983 | 0.327660588017234 |
| 44 | 115.05 | 114.76691857616 | 0.283081423839981 |
| 45 | 116.67 | 116.204400944503 | 0.465599055497138 |
| 46 | 117.07 | 116.624270349262 | 0.445729650737925 |
| 47 | 116.92 | 116.803040298828 | 0.116959701171746 |
| 48 | 117 | 117.012219724425 | -0.0122197244247304 |
| 49 | 117.02 | 117.203572905452 | -0.183572905451731 |
| 50 | 117.35 | 117.412752331048 | -0.0627523310482051 |
| 51 | 117.36 | 117.604105512075 | -0.244105512075196 |
| 52 | 117.82 | 118.079225627778 | -0.259225627778147 |
| 53 | 117.88 | 118.268481603562 | -0.388481603561674 |
| 54 | 118.24 | 118.50282749208 | -0.262827492079764 |
| 55 | 118.5 | 118.683694646889 | -0.183694646889414 |
| 56 | 118.8 | 118.862464596456 | -0.0624645964556042 |
| 57 | 119.76 | 119.6886577471 | 0.0713422528997079 |
| 58 | 120.09 | 119.867427696666 | 0.222572303333519 |
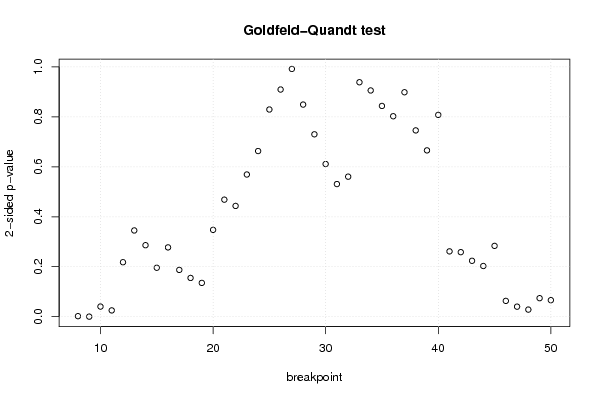
| Goldfeld-Quandt test for Heteroskedasticity | |||
| p-values | Alternative Hypothesis | ||
| breakpoint index | greater | 2-sided | less |
| 8 | 0.00106771540000923 | 0.00213543080001846 | 0.998932284599991 |
| 9 | 8.29172946740738e-05 | 0.000165834589348148 | 0.999917082705326 |
| 10 | 0.0202576939307536 | 0.0405153878615072 | 0.979742306069246 |
| 11 | 0.0126024341060593 | 0.0252048682121186 | 0.987397565893941 |
| 12 | 0.109040383060431 | 0.218080766120863 | 0.890959616939568 |
| 13 | 0.172617050094513 | 0.345234100189025 | 0.827382949905487 |
| 14 | 0.143086676535669 | 0.286173353071338 | 0.856913323464331 |
| 15 | 0.0979231660618458 | 0.195846332123692 | 0.902076833938154 |
| 16 | 0.138726408742854 | 0.277452817485708 | 0.861273591257146 |
| 17 | 0.0936401032911991 | 0.187280206582398 | 0.906359896708801 |
| 18 | 0.0775673263447603 | 0.155134652689521 | 0.92243267365524 |
| 19 | 0.0676213465226061 | 0.135242693045212 | 0.932378653477394 |
| 20 | 0.173807302023095 | 0.34761460404619 | 0.826192697976905 |
| 21 | 0.234267235231306 | 0.468534470462612 | 0.765732764768694 |
| 22 | 0.2217361152917 | 0.4434722305834 | 0.7782638847083 |
| 23 | 0.284629378857498 | 0.569258757714996 | 0.715370621142502 |
| 24 | 0.331591495396573 | 0.663182990793145 | 0.668408504603427 |
| 25 | 0.414759987357779 | 0.829519974715558 | 0.585240012642221 |
| 26 | 0.545279448964705 | 0.90944110207059 | 0.454720551035295 |
| 27 | 0.504071627341121 | 0.991856745317758 | 0.495928372658879 |
| 28 | 0.424631387716155 | 0.84926277543231 | 0.575368612283845 |
| 29 | 0.365112399557213 | 0.730224799114427 | 0.634887600442787 |
| 30 | 0.305597259502646 | 0.611194519005292 | 0.694402740497354 |
| 31 | 0.265512919455409 | 0.531025838910818 | 0.734487080544591 |
| 32 | 0.280294367856022 | 0.560588735712044 | 0.719705632143978 |
| 33 | 0.530698358582404 | 0.938603282835192 | 0.469301641417596 |
| 34 | 0.452862877824303 | 0.905725755648606 | 0.547137122175697 |
| 35 | 0.421833990343673 | 0.843667980687346 | 0.578166009656327 |
| 36 | 0.4012529519312 | 0.802505903862401 | 0.5987470480688 |
| 37 | 0.449286159598296 | 0.898572319196592 | 0.550713840401704 |
| 38 | 0.372923504996762 | 0.745847009993525 | 0.627076495003238 |
| 39 | 0.332927668002659 | 0.665855336005318 | 0.667072331997341 |
| 40 | 0.403951625790802 | 0.807903251581605 | 0.596048374209198 |
| 41 | 0.869209695252931 | 0.261580609494138 | 0.130790304747069 |
| 42 | 0.870847204475145 | 0.25830559104971 | 0.129152795524855 |
| 43 | 0.888110771113431 | 0.223778457773138 | 0.111889228886569 |
| 44 | 0.898537106174736 | 0.202925787650528 | 0.101462893825264 |
| 45 | 0.858229888192513 | 0.283540223614974 | 0.141770111807487 |
| 46 | 0.968357375520605 | 0.06328524895879 | 0.031642624479395 |
| 47 | 0.979918174732421 | 0.0401636505351584 | 0.0200818252675792 |
| 48 | 0.985794984605449 | 0.028410030789102 | 0.014205015394551 |
| 49 | 0.962950697620362 | 0.0740986047592751 | 0.0370493023796375 |
| 50 | 0.966943886863083 | 0.0661122262738333 | 0.0330561131369167 |
| Meta Analysis of Goldfeld-Quandt test for Heteroskedasticity | |||
| Description | # significant tests | % significant tests | OK/NOK |
| 1% type I error level | 2 | 0.0465116279069767 | NOK |
| 5% type I error level | 6 | 0.13953488372093 | NOK |
| 10% type I error level | 9 | 0.209302325581395 | NOK |