| Multiple Linear Regression - Estimated Regression Equation |
| Super95[t] = -0.00248381772087863 + 0.97947458025983Super98[t] + 0.0130008809431486Diesel[t] -0.0133885092431644Gasolie[t] + 0.00384030378759557LPG[t] + e[t] |
| Multiple Linear Regression - Ordinary Least Squares | |||||
| Variable | Parameter | S.D. | T-STAT H0: parameter = 0 | 2-tail p-value | 1-tail p-value |
| (Intercept) | -0.00248381772087863 | 0.007972 | -0.3116 | 0.756842 | 0.378421 |
| Super98 | 0.97947458025983 | 0.006689 | 146.4248 | 0 | 0 |
| Diesel | 0.0130008809431486 | 0.013281 | 0.9789 | 0.332984 | 0.166492 |
| Gasolie | -0.0133885092431644 | 0.014757 | -0.9073 | 0.36921 | 0.184605 |
| LPG | 0.00384030378759557 | 0.004725 | 0.8128 | 0.420716 | 0.210358 |
| Multiple Linear Regression - Regression Statistics | |
| Multiple R | 0.999791225570011 |
| R-squared | 0.999582494726785 |
| Adjusted R-squared | 0.999544539701948 |
| F-TEST (value) | 26335.9726149891 |
| F-TEST (DF numerator) | 4 |
| F-TEST (DF denominator) | 44 |
| p-value | 0 |
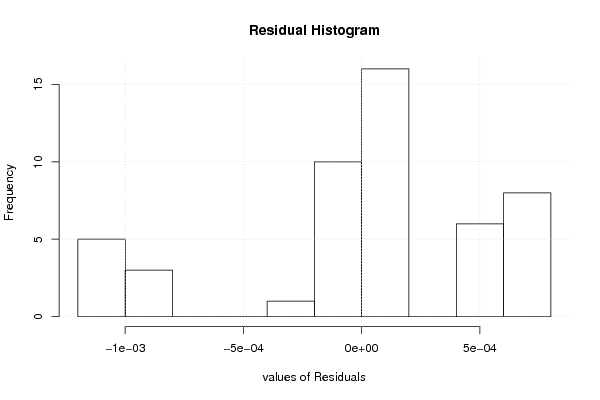
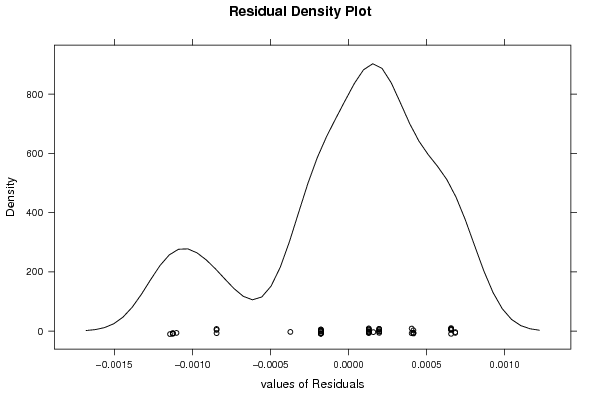
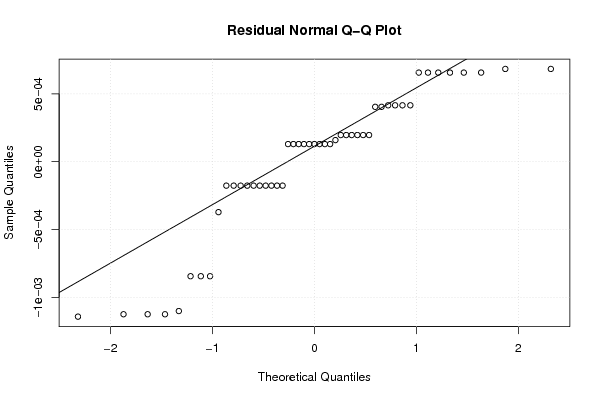
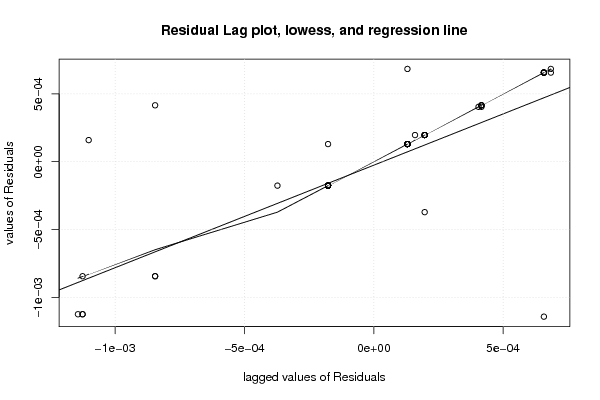
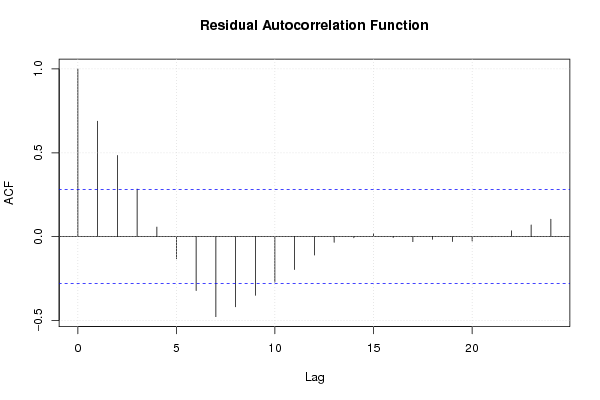
| Multiple Linear Regression - Residual Statistics | |
| Residual Standard Deviation | 0.000561483509472919 |
| Sum Squared Residuals | 1.38716041820411e-05 |
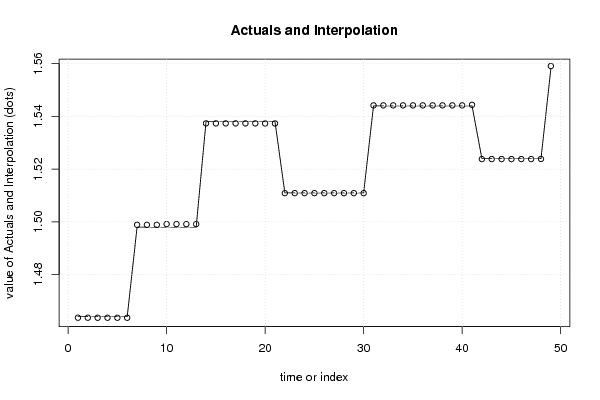
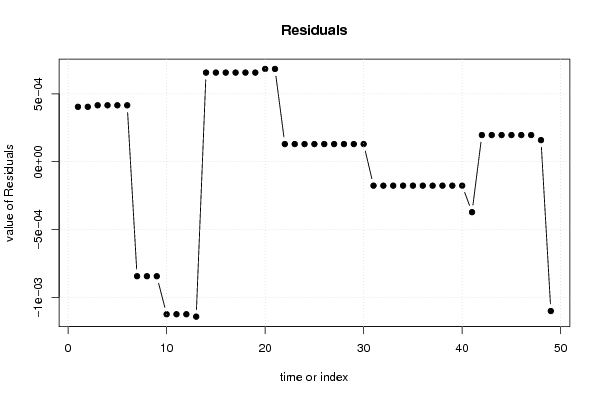
| Multiple Linear Regression - Actuals, Interpolation, and Residuals | |||
| Time or Index | Actuals | Interpolation Forecast | Residuals Prediction Error |
| 1 | 1.464 | 1.46359518791627 | 0.000404812083733953 |
| 2 | 1.464 | 1.46359518791627 | 0.000404812083733774 |
| 3 | 1.464 | 1.46358391099931 | 0.000416089000685684 |
| 4 | 1.464 | 1.46358391099931 | 0.000416089000685684 |
| 5 | 1.464 | 1.46358391099931 | 0.000416089000685684 |
| 6 | 1.464 | 1.46358391099931 | 0.000416089000685684 |
| 7 | 1.498 | 1.49884499588867 | -0.00084499588866797 |
| 8 | 1.498 | 1.49884499588867 | -0.00084499588866797 |
| 9 | 1.498 | 1.49884499588867 | -0.00084499588866797 |
| 10 | 1.498 | 1.49912533806516 | -0.00112533806516245 |
| 11 | 1.498 | 1.49912533806516 | -0.00112533806516245 |
| 12 | 1.498 | 1.49912533806516 | -0.00112533806516245 |
| 13 | 1.498 | 1.4991431639365 | -0.00114316393649693 |
| 14 | 1.538 | 1.53734267256663 | 0.000657327433369591 |
| 15 | 1.538 | 1.53734267256663 | 0.000657327433369591 |
| 16 | 1.538 | 1.53734267256663 | 0.000657327433369591 |
| 17 | 1.538 | 1.53734267256663 | 0.000657327433369591 |
| 18 | 1.538 | 1.53734267256663 | 0.000657327433369591 |
| 19 | 1.538 | 1.53734267256663 | 0.000657327433369591 |
| 20 | 1.538 | 1.53731579044012 | 0.00068420955988276 |
| 21 | 1.538 | 1.53731579044012 | 0.00068420955988276 |
| 22 | 1.511 | 1.5108699767731 | 0.000130023226898166 |
| 23 | 1.511 | 1.5108699767731 | 0.000130023226898166 |
| 24 | 1.511 | 1.5108699767731 | 0.000130023226898166 |
| 25 | 1.511 | 1.5108699767731 | 0.000130023226898166 |
| 26 | 1.511 | 1.5108699767731 | 0.000130023226898166 |
| 27 | 1.511 | 1.5108699767731 | 0.000130023226898166 |
| 28 | 1.511 | 1.5108699767731 | 0.000130023226898166 |
| 29 | 1.511 | 1.5108699767731 | 0.000130023226898166 |
| 30 | 1.511 | 1.5108699767731 | 0.000130023226898166 |
| 31 | 1.544 | 1.5441767615263 | -0.000176761526303013 |
| 32 | 1.544 | 1.5441767615263 | -0.000176761526303013 |
| 33 | 1.544 | 1.5441767615263 | -0.000176761526303013 |
| 34 | 1.544 | 1.5441767615263 | -0.000176761526303013 |
| 35 | 1.544 | 1.5441767615263 | -0.000176761526303013 |
| 36 | 1.544 | 1.5441767615263 | -0.000176761526303013 |
| 37 | 1.544 | 1.5441767615263 | -0.000176761526303013 |
| 38 | 1.544 | 1.5441767615263 | -0.000176761526303013 |
| 39 | 1.544 | 1.5441767615263 | -0.000176761526303013 |
| 40 | 1.544 | 1.5441767615263 | -0.000176761526303013 |
| 41 | 1.544 | 1.54437230515376 | -0.000372305153756167 |
| 42 | 1.524 | 1.5238033389683 | 0.000196661031700155 |
| 43 | 1.524 | 1.5238033389683 | 0.000196661031700155 |
| 44 | 1.524 | 1.5238033389683 | 0.000196661031700155 |
| 45 | 1.524 | 1.5238033389683 | 0.000196661031700155 |
| 46 | 1.524 | 1.5238033389683 | 0.000196661031700155 |
| 47 | 1.524 | 1.5238033389683 | 0.000196661031700155 |
| 48 | 1.524 | 1.52384068400917 | 0.000159315990825204 |
| 49 | 1.558 | 1.55910176889853 | -0.00110176889852868 |
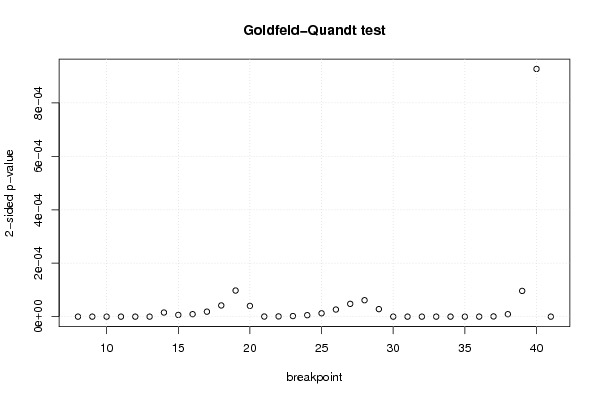
| Goldfeld-Quandt test for Heteroskedasticity | |||
| p-values | Alternative Hypothesis | ||
| breakpoint index | greater | 2-sided | less |
| 8 | 7.98365832036863e-40 | 1.59673166407373e-39 | 1 |
| 9 | 8.96017220922493e-50 | 1.79203444184499e-49 | 1 |
| 10 | 2.16880276269315e-72 | 4.33760552538629e-72 | 1 |
| 11 | 5.48947691168286e-75 | 1.09789538233657e-74 | 1 |
| 12 | 1.32917535700119e-85 | 2.65835071400238e-85 | 1 |
| 13 | 4.34746551731754e-111 | 8.69493103463509e-111 | 1 |
| 14 | 0.999992261515679 | 1.54769686415272e-05 | 7.73848432076361e-06 |
| 15 | 0.999996752822862 | 6.49435427518717e-06 | 3.24717713759359e-06 |
| 16 | 0.999995351278254 | 9.29744349214836e-06 | 4.64872174607418e-06 |
| 17 | 0.999990677958717 | 1.86440825667158e-05 | 9.32204128335792e-06 |
| 18 | 0.999979023072311 | 4.19538553771305e-05 | 2.09769276885653e-05 |
| 19 | 0.999951124368648 | 9.77512627042291e-05 | 4.88756313521145e-05 |
| 20 | 0.999979891216806 | 4.02175663877038e-05 | 2.01087831938519e-05 |
| 21 | 0.999999790294858 | 4.19410285032729e-07 | 2.09705142516365e-07 |
| 22 | 0.999999528916667 | 9.42166666326614e-07 | 4.71083333163307e-07 |
| 23 | 0.999998866358303 | 2.26728339456737e-06 | 1.13364169728368e-06 |
| 24 | 0.999997269861481 | 5.46027703754306e-06 | 2.73013851877153e-06 |
| 25 | 0.999993703535026 | 1.25929299477385e-05 | 6.29646497386926e-06 |
| 26 | 0.999986699967105 | 2.66000657901359e-05 | 1.3300032895068e-05 |
| 27 | 0.999976065708186 | 4.78685836271258e-05 | 2.39342918135629e-05 |
| 28 | 0.999969245916454 | 6.15081670925856e-05 | 3.07540835462928e-05 |
| 29 | 0.99998590858294 | 2.81828341208685e-05 | 1.40914170604342e-05 |
| 30 | 0.999999999999981 | 3.77350945840085e-14 | 1.88675472920042e-14 |
| 31 | 0.99999999999986 | 2.79161885076541e-13 | 1.39580942538271e-13 |
| 32 | 0.999999999998541 | 2.91741145727446e-12 | 1.45870572863723e-12 |
| 33 | 0.999999999982518 | 3.49646313586391e-11 | 1.74823156793196e-11 |
| 34 | 0.999999999779881 | 4.40237263382954e-10 | 2.20118631691477e-10 |
| 35 | 0.999999997215887 | 5.56822520163284e-09 | 2.78411260081642e-09 |
| 36 | 0.999999965559406 | 6.88811876062237e-08 | 3.44405938031118e-08 |
| 37 | 0.999999590959296 | 8.18081408837048e-07 | 4.09040704418524e-07 |
| 38 | 0.999995404857666 | 9.190284668306e-06 | 4.595142334153e-06 |
| 39 | 0.999951849807376 | 9.63003852484913e-05 | 4.81501926242456e-05 |
| 40 | 0.999536441426507 | 0.000927117146985057 | 0.000463558573492528 |
| 41 | 1 | 2.67471392728967e-37 | 1.33735696364484e-37 |
| Meta Analysis of Goldfeld-Quandt test for Heteroskedasticity | |||
| Description | # significant tests | % significant tests | OK/NOK |
| 1% type I error level | 34 | 1 | NOK |
| 5% type I error level | 34 | 1 | NOK |
| 10% type I error level | 34 | 1 | NOK |