| Multiple Linear Regression - Estimated Regression Equation |
| Mortality[t] = + 12.9682781330485 + 0.117528569667981Marriage[t] -0.115378003055659t + e[t] |
| Multiple Linear Regression - Ordinary Least Squares | |||||
| Variable | Parameter | S.D. | T-STAT H0: parameter = 0 | 2-tail p-value | 1-tail p-value |
| (Intercept) | 12.9682781330485 | 2.110089 | 6.1458 | 0 | 0 |
| Marriage | 0.117528569667981 | 0.027051 | 4.3447 | 8.4e-05 | 4.2e-05 |
| t | -0.115378003055659 | 0.009733 | -11.854 | 0 | 0 |
| Multiple Linear Regression - Regression Statistics | |
| Multiple R | 0.988726055970538 |
| R-squared | 0.977579213755055 |
| Adjusted R-squared | 0.976536386487849 |
| F-TEST (value) | 937.431580949699 |
| F-TEST (DF numerator) | 2 |
| F-TEST (DF denominator) | 43 |
| p-value | 0 |
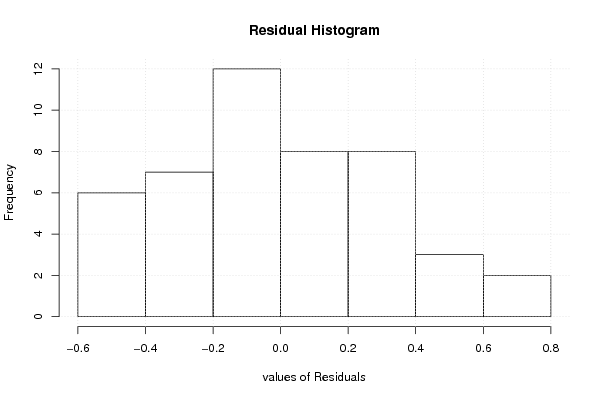
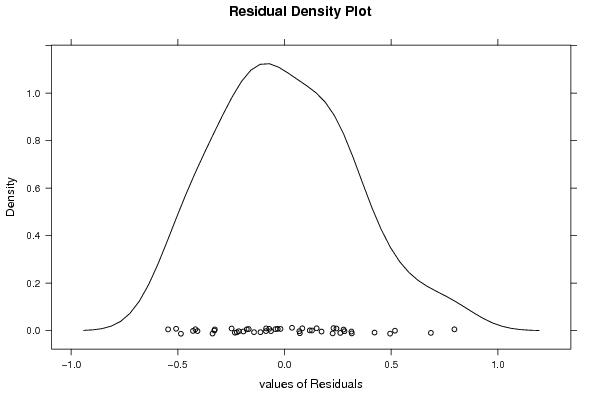
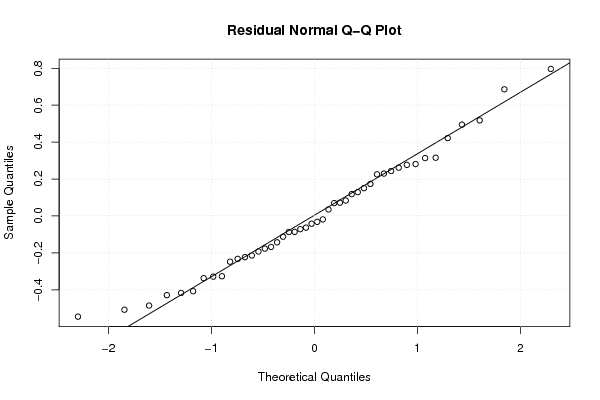
| Multiple Linear Regression - Residual Statistics | |
| Residual Standard Deviation | 0.323296711055791 |
| Sum Squared Residuals | 4.49439282531814 |
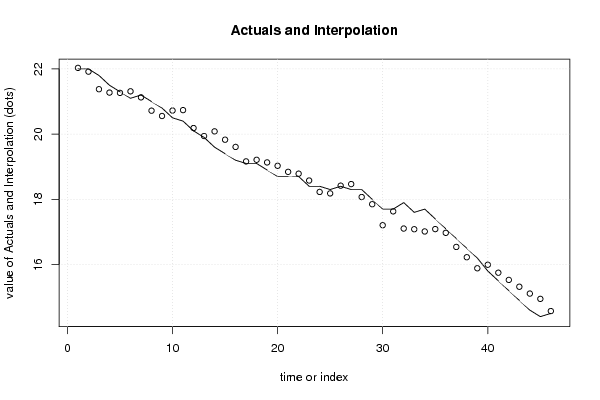
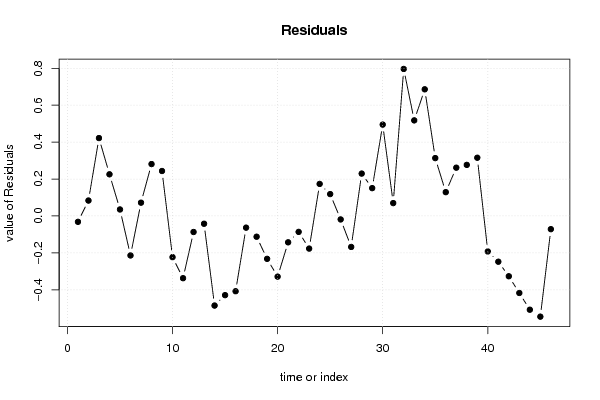
| Multiple Linear Regression - Actuals, Interpolation, and Residuals | |||
| Time or Index | Actuals | Interpolation Forecast | Residuals Prediction Error |
| 1 | 22 | 22.0318814210622 | -0.0318814210621677 |
| 2 | 22 | 21.9165034180065 | 0.0834965819935006 |
| 3 | 21.8 | 21.3780225641461 | 0.421977435853892 |
| 4 | 21.5 | 21.2743974180572 | 0.225602581942752 |
| 5 | 21.3 | 21.2647951277028 | 0.0352048722972274 |
| 6 | 21.1 | 21.3139571221823 | -0.213957122182288 |
| 7 | 21.2 | 21.1280619773258 | 0.0719380226741583 |
| 8 | 21 | 20.7188625501002 | 0.281137449899771 |
| 9 | 20.8 | 20.5564731191774 | 0.243526880822622 |
| 10 | 20.5 | 20.7231636833249 | -0.223163683324874 |
| 11 | 20.4 | 20.737067106904 | -0.337067106903998 |
| 12 | 20.1 | 20.1868333960768 | -0.0868333960768049 |
| 13 | 19.9 | 19.9421739663864 | -0.0421739663863689 |
| 14 | 19.6 | 20.0853588166003 | -0.485358816600267 |
| 15 | 19.4 | 19.828946529943 | -0.428946529943033 |
| 16 | 19.2 | 19.6077928141862 | -0.407792814186191 |
| 17 | 19.1 | 19.1633348160602 | -0.0633348160601831 |
| 18 | 19.1 | 19.2124968105397 | -0.112496810539698 |
| 19 | 18.9 | 19.1323773783844 | -0.232377378384436 |
| 20 | 18.7 | 19.0287522322956 | -0.328752232295576 |
| 21 | 18.7 | 18.8428570874391 | -0.142857087439128 |
| 22 | 18.7 | 18.7862433692175 | -0.0862433692174596 |
| 23 | 18.4 | 18.5768425104274 | -0.176842510427417 |
| 24 | 18.4 | 18.2264073680358 | 0.173592631964204 |
| 25 | 18.3 | 18.1815465067809 | 0.118453493219075 |
| 26 | 18.4 | 18.4187542127292 | -0.0187542127292125 |
| 27 | 18.3 | 18.4679162072087 | -0.167916207208725 |
| 28 | 18.3 | 18.0704696369499 | 0.229530363050088 |
| 29 | 18 | 17.8493159211931 | 0.15068407880693 |
| 30 | 17.7 | 17.2050593546315 | 0.494940645368504 |
| 31 | 17.7 | 17.6303127720486 | 0.0696872279514488 |
| 32 | 17.9 | 17.103584775155 | 0.796415224845042 |
| 33 | 17.6 | 17.0822296278337 | 0.517770372166316 |
| 34 | 17.7 | 17.0138630526452 | 0.686136947354781 |
| 35 | 17.4 | 17.0865307610583 | 0.313469238941668 |
| 36 | 17.1 | 16.9711527580027 | 0.128847241997329 |
| 37 | 16.8 | 16.5384476168435 | 0.261552383156537 |
| 38 | 16.5 | 16.2232710453522 | 0.276728954647764 |
| 39 | 16.2 | 15.8845887599274 | 0.315411240072586 |
| 40 | 15.8 | 15.9925150392409 | -0.192515039240918 |
| 41 | 15.5 | 15.7478556095505 | -0.247855609550481 |
| 42 | 15.2 | 15.5267018937936 | -0.32670189379364 |
| 43 | 14.9 | 15.3173010350036 | -0.417301035003595 |
| 44 | 14.6 | 15.1079001762136 | -0.507900176213552 |
| 45 | 14.4 | 14.9455107452907 | -0.5455107452907 |
| 46 | 14.5 | 14.5715698889655 | -0.0715698889654829 |
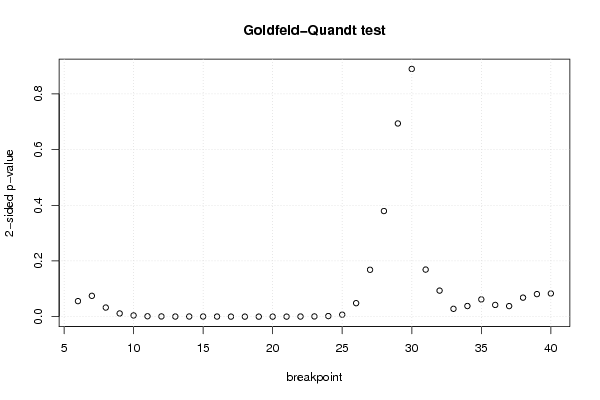
| Goldfeld-Quandt test for Heteroskedasticity | |||
| p-values | Alternative Hypothesis | ||
| breakpoint index | greater | 2-sided | less |
| 6 | 0.0279488376435577 | 0.0558976752871154 | 0.972051162356442 |
| 7 | 0.0374235380654946 | 0.0748470761309892 | 0.962576461934505 |
| 8 | 0.0163692891637035 | 0.0327385783274071 | 0.983630710836296 |
| 9 | 0.00574352113224292 | 0.0114870422644858 | 0.994256478867757 |
| 10 | 0.00224113400141067 | 0.00448226800282133 | 0.997758865998589 |
| 11 | 0.0006960879462457 | 0.0013921758924914 | 0.999303912053754 |
| 12 | 0.000429100473132749 | 0.000858200946265499 | 0.999570899526867 |
| 13 | 0.000213704832292901 | 0.000427409664585802 | 0.999786295167707 |
| 14 | 0.000295251149069011 | 0.000590502298138022 | 0.999704748850931 |
| 15 | 0.000266198956813211 | 0.000532397913626422 | 0.999733801043187 |
| 16 | 0.000203114613509499 | 0.000406229227018999 | 0.99979688538649 |
| 17 | 6.81316628674331e-05 | 0.000136263325734866 | 0.999931868337133 |
| 18 | 4.38857679219922e-05 | 8.77715358439844e-05 | 0.999956114232078 |
| 19 | 2.47375503319126e-05 | 4.94751006638251e-05 | 0.999975262449668 |
| 20 | 1.70268882907759e-05 | 3.40537765815518e-05 | 0.999982973111709 |
| 21 | 3.43580596299863e-05 | 6.87161192599726e-05 | 0.99996564194037 |
| 22 | 0.000233506048327242 | 0.000467012096654484 | 0.999766493951673 |
| 23 | 0.000410089775811914 | 0.000820179551623828 | 0.999589910224188 |
| 24 | 0.00107041138103602 | 0.00214082276207204 | 0.998929588618964 |
| 25 | 0.00353193546907873 | 0.00706387093815747 | 0.996468064530921 |
| 26 | 0.0242344675463817 | 0.0484689350927635 | 0.975765532453618 |
| 27 | 0.0842036406480574 | 0.168407281296115 | 0.915796359351943 |
| 28 | 0.189716373529855 | 0.379432747059711 | 0.810283626470145 |
| 29 | 0.346975728795012 | 0.693951457590024 | 0.653024271204988 |
| 30 | 0.555122933774409 | 0.889754132451182 | 0.444877066225591 |
| 31 | 0.91543819256177 | 0.169123614876459 | 0.0845618074382296 |
| 32 | 0.953224690504105 | 0.0935506189917904 | 0.0467753094958952 |
| 33 | 0.985908846391029 | 0.0281823072179423 | 0.0140911536089712 |
| 34 | 0.980873143989643 | 0.0382537120207135 | 0.0191268560103568 |
| 35 | 0.968997709678904 | 0.0620045806421922 | 0.0310022903210961 |
| 36 | 0.978954030100786 | 0.0420919397984278 | 0.0210459698992139 |
| 37 | 0.981009993299952 | 0.0379800134000958 | 0.0189900067000479 |
| 38 | 0.965848022378807 | 0.0683039552423853 | 0.0341519776211927 |
| 39 | 0.959470933793447 | 0.0810581324131069 | 0.0405290662065535 |
| 40 | 0.958365784636968 | 0.0832684307260646 | 0.0416342153630323 |
| Meta Analysis of Goldfeld-Quandt test for Heteroskedasticity | |||
| Description | # significant tests | % significant tests | OK/NOK |
| 1% type I error level | 16 | 0.457142857142857 | NOK |
| 5% type I error level | 23 | 0.657142857142857 | NOK |
| 10% type I error level | 30 | 0.857142857142857 | NOK |