| Multiple Linear Regression - Estimated Regression Equation |
| CVI[t] = + 0.0742065942476632 + 25.7100393622267Maand[t] + 0.25438648740141Econ.Sit.[t] -0.2533769927961Werkloos[t] + 0.268755591524534Fin.Sit.[t] + 0.219697792549098Spaarverm.[t] + e[t] |
| Multiple Linear Regression - Ordinary Least Squares | |||||
| Variable | Parameter | S.D. | T-STAT H0: parameter = 0 | 2-tail p-value | 1-tail p-value |
| (Intercept) | 0.0742065942476632 | 0.10886 | 0.6817 | 0.498308 | 0.249154 |
| Maand | 25.7100393622267 | 9.412789 | 2.7314 | 0.00846 | 0.00423 |
| Econ.Sit. | 0.25438648740141 | 0.005639 | 45.1085 | 0 | 0 |
| Werkloos | -0.2533769927961 | 0.001832 | -138.333 | 0 | 0 |
| Fin.Sit. | 0.268755591524534 | 0.028899 | 9.2997 | 0 | 0 |
| Spaarverm. | 0.219697792549098 | 0.013993 | 15.7006 | 0 | 0 |
| Multiple Linear Regression - Regression Statistics | |
| Multiple R | 0.999291975862363 |
| R-squared | 0.998584453022906 |
| Adjusted R-squared | 0.99845576693408 |
| F-TEST (value) | 7759.84772035194 |
| F-TEST (DF numerator) | 5 |
| F-TEST (DF denominator) | 55 |
| p-value | 0 |
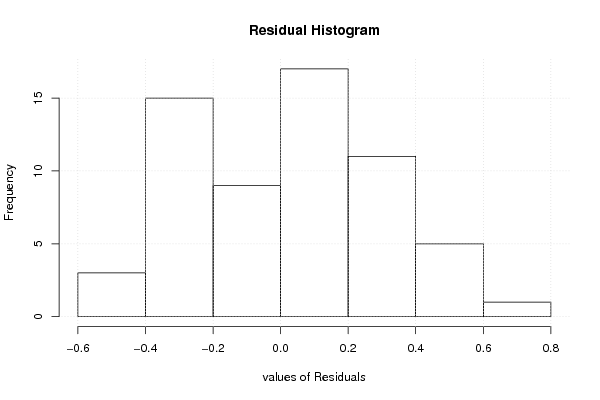
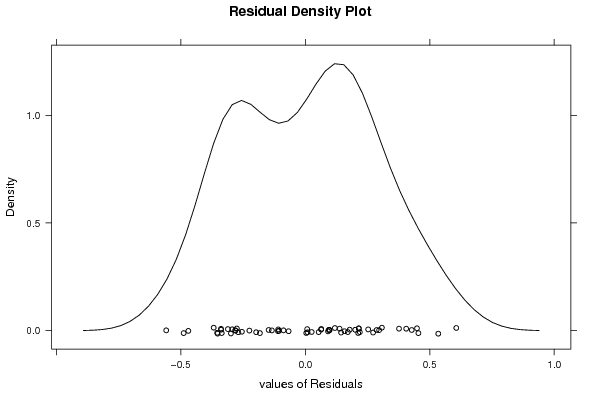
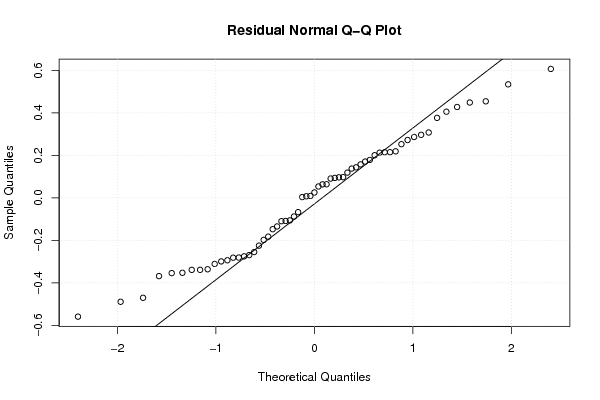
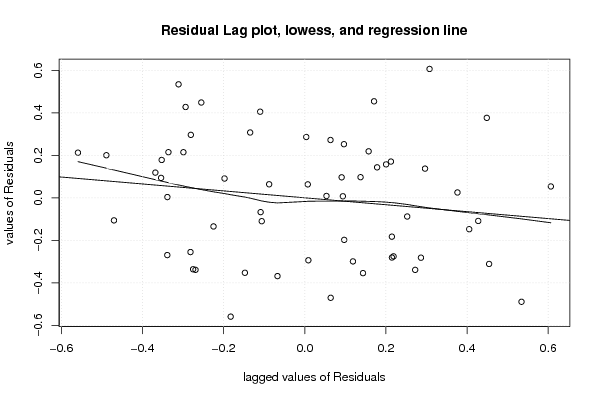
| Multiple Linear Regression - Residual Statistics | |
| Residual Standard Deviation | 0.292915423966701 |
| Sum Squared Residuals | 4.71896950786756 |
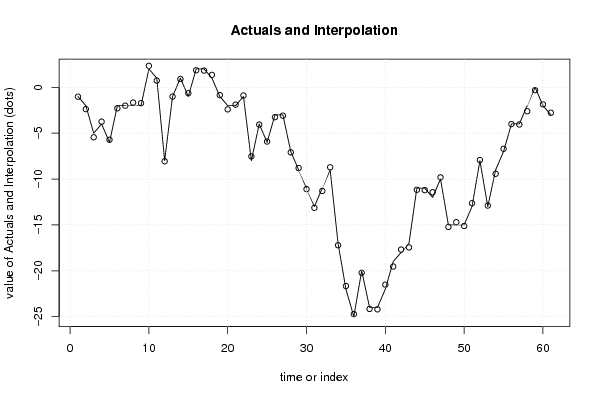
| Multiple Linear Regression - Actuals, Interpolation, and Residuals | |||
| Time or Index | Actuals | Interpolation Forecast | Residuals Prediction Error |
| 1 | -1 | -1.0252910034739 | 0.0252910034738983 |
| 2 | -2 | -2.3763503505821 | 0.376350350582097 |
| 3 | -5 | -5.44859623632706 | 0.448596236327056 |
| 4 | -4 | -3.74495010191976 | -0.255049898080245 |
| 5 | -6 | -5.71834718196698 | -0.281652818033019 |
| 6 | -2 | -2.28637079189692 | 0.286370791896923 |
| 7 | -2 | -2.00360986930715 | 0.00360986930714726 |
| 8 | -2 | -1.66133763574493 | -0.338662364255066 |
| 9 | -2 | -1.73069735297259 | -0.269302647027415 |
| 10 | 2 | 2.33885756234189 | -0.338857562341894 |
| 11 | 1 | 0.72782803422781 | 0.27217196577219 |
| 12 | -8 | -8.06339398004629 | 0.0633939800462851 |
| 13 | -1 | -1.00741336904406 | 0.00741336904405529 |
| 14 | 1 | 0.906120532380984 | 0.0938794676190164 |
| 15 | -1 | -0.645839981495251 | -0.354160018504749 |
| 16 | 2 | 1.85645689492614 | 0.143543105073857 |
| 17 | 2 | 1.82172805728753 | 0.178271942712473 |
| 18 | 1 | 1.35259114722183 | -0.352591147221827 |
| 19 | -1 | -0.85249137491042 | -0.14750862508958 |
| 20 | -2 | -2.40531822834617 | 0.405318228346169 |
| 21 | -2 | -1.89012449371224 | -0.109875506287765 |
| 22 | -1 | -0.893974669592924 | -0.106025330407076 |
| 23 | -8 | -7.52975380412517 | -0.470246195874825 |
| 24 | -4 | -4.06392182948702 | 0.0639218294870249 |
| 25 | -6 | -5.91222838764621 | -0.0877716123537893 |
| 26 | -3 | -3.25249126567936 | 0.252491265679364 |
| 27 | -3 | -3.09658026512153 | 0.0965802651215325 |
| 28 | -7 | -7.09089946812391 | 0.0908994681239113 |
| 29 | -9 | -8.80225933956962 | -0.197740660430383 |
| 30 | -11 | -11.0972203075367 | 0.097220307536713 |
| 31 | -13 | -13.1375031962049 | 0.137503196204865 |
| 32 | -11 | -11.2964207232031 | 0.296420723203072 |
| 33 | -9 | -8.71918741159176 | -0.280812588408236 |
| 34 | -17 | -17.21483899701 | 0.21483899701001 |
| 35 | -22 | -21.6639809949885 | -0.336019005011509 |
| 36 | -25 | -24.7247549629406 | -0.275245037059388 |
| 37 | -20 | -20.2188567671814 | 0.218856767181363 |
| 38 | -24 | -24.1574659558312 | 0.157465955831178 |
| 39 | -24 | -24.2004583729843 | 0.200458372984346 |
| 40 | -22 | -21.5109907957065 | -0.489009204293536 |
| 41 | -19 | -19.5341842331716 | 0.534184233171559 |
| 42 | -18 | -17.6889022203158 | -0.31109777968421 |
| 43 | -17 | -17.4542851467044 | 0.454285146704413 |
| 44 | -11 | -11.1707419829931 | 0.170741982993075 |
| 45 | -11 | -11.2123626197673 | 0.212362619767342 |
| 46 | -12 | -11.440996966212 | -0.55900303378804 |
| 47 | -10 | -9.81740089810138 | -0.182599101898618 |
| 48 | -15 | -15.2146911450732 | 0.214691145073192 |
| 49 | -15 | -14.7009077777946 | -0.299092222205399 |
| 50 | -15 | -15.1187435683282 | 0.11874356832821 |
| 51 | -13 | -12.6317677286589 | -0.368232271341093 |
| 52 | -8 | -7.93277023848031 | -0.0672297615196931 |
| 53 | -13 | -12.891188606427 | -0.108811393573037 |
| 54 | -9 | -9.42752139858626 | 0.427521398586263 |
| 55 | -7 | -6.7062880906631 | -0.293711909336897 |
| 56 | -4 | -4.00885245587298 | 0.00885245587298183 |
| 57 | -4 | -4.05349812773585 | 0.0534981277358544 |
| 58 | -2 | -2.60650115592723 | 0.606501155927233 |
| 59 | 0 | -0.307527724751144 | 0.307527724751144 |
| 60 | -2 | -1.86543549006288 | -0.134564509937117 |
| 61 | -3 | -2.77509518648859 | -0.224904813511406 |
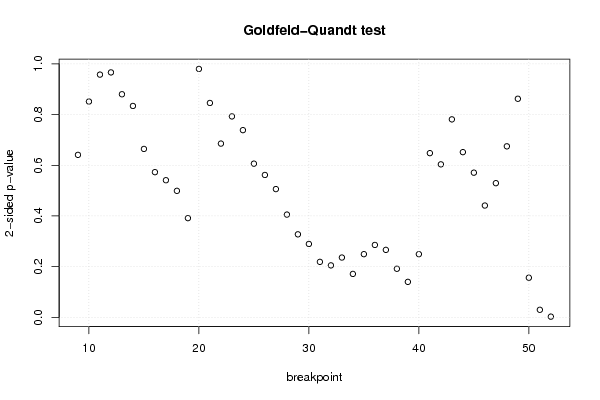
| Goldfeld-Quandt test for Heteroskedasticity | |||
| p-values | Alternative Hypothesis | ||
| breakpoint index | greater | 2-sided | less |
| 9 | 0.679530425397887 | 0.640939149204226 | 0.320469574602113 |
| 10 | 0.574345090598069 | 0.851309818803863 | 0.425654909401931 |
| 11 | 0.521280190818673 | 0.957439618362653 | 0.478719809181327 |
| 12 | 0.516938995351128 | 0.966122009297745 | 0.483061004648872 |
| 13 | 0.440032095730553 | 0.880064191461106 | 0.559967904269447 |
| 14 | 0.416891212346991 | 0.833782424693982 | 0.583108787653009 |
| 15 | 0.332171932904324 | 0.664343865808648 | 0.667828067095676 |
| 16 | 0.286395620475446 | 0.572791240950892 | 0.713604379524554 |
| 17 | 0.270502265378067 | 0.541004530756133 | 0.729497734621933 |
| 18 | 0.249577728657777 | 0.499155457315553 | 0.750422271342223 |
| 19 | 0.195764886220081 | 0.391529772440162 | 0.804235113779919 |
| 20 | 0.489887743037955 | 0.979775486075909 | 0.510112256962045 |
| 21 | 0.422800193353377 | 0.845600386706753 | 0.577199806646623 |
| 22 | 0.34272719708784 | 0.685454394175679 | 0.65727280291216 |
| 23 | 0.396311601725745 | 0.79262320345149 | 0.603688398274255 |
| 24 | 0.369247755384357 | 0.738495510768715 | 0.630752244615642 |
| 25 | 0.303153081827622 | 0.606306163655244 | 0.696846918172378 |
| 26 | 0.280879474204232 | 0.561758948408465 | 0.719120525795768 |
| 27 | 0.253054319495057 | 0.506108638990113 | 0.746945680504943 |
| 28 | 0.202753930565684 | 0.405507861131368 | 0.797246069434316 |
| 29 | 0.163833397851268 | 0.327666795702535 | 0.836166602148732 |
| 30 | 0.144841929852948 | 0.289683859705896 | 0.855158070147052 |
| 31 | 0.109500624240617 | 0.219001248481235 | 0.890499375759383 |
| 32 | 0.102607493444898 | 0.205214986889797 | 0.897392506555102 |
| 33 | 0.118071594864899 | 0.236143189729799 | 0.881928405135101 |
| 34 | 0.0857607415354528 | 0.171521483070906 | 0.914239258464547 |
| 35 | 0.124725786142193 | 0.249451572284385 | 0.875274213857807 |
| 36 | 0.142896477510936 | 0.285792955021871 | 0.857103522489065 |
| 37 | 0.133149027663902 | 0.266298055327803 | 0.866850972336099 |
| 38 | 0.0959379000081421 | 0.191875800016284 | 0.904062099991858 |
| 39 | 0.0701009310665395 | 0.140201862133079 | 0.929899068933461 |
| 40 | 0.124653534236931 | 0.249307068473862 | 0.875346465763069 |
| 41 | 0.323902927043277 | 0.647805854086554 | 0.676097072956723 |
| 42 | 0.301797430201167 | 0.603594860402333 | 0.698202569798833 |
| 43 | 0.390489936178784 | 0.780979872357567 | 0.609510063821216 |
| 44 | 0.325876757889589 | 0.651753515779179 | 0.674123242110411 |
| 45 | 0.285384821171776 | 0.570769642343551 | 0.714615178828224 |
| 46 | 0.77941457594384 | 0.44117084811232 | 0.22058542405616 |
| 47 | 0.735301130870328 | 0.529397738259345 | 0.264698869129672 |
| 48 | 0.66264158341651 | 0.67471683316698 | 0.33735841658349 |
| 49 | 0.568887081993284 | 0.862225836013433 | 0.431112918006716 |
| 50 | 0.921749129865985 | 0.15650174026803 | 0.0782508701340149 |
| 51 | 0.984969778121372 | 0.0300604437572559 | 0.0150302218786279 |
| 52 | 0.998477063853559 | 0.00304587229288235 | 0.00152293614644118 |
| Meta Analysis of Goldfeld-Quandt test for Heteroskedasticity | |||
| Description | # significant tests | % significant tests | OK/NOK |
| 1% type I error level | 1 | 0.0227272727272727 | NOK |
| 5% type I error level | 2 | 0.0454545454545455 | OK |
| 10% type I error level | 2 | 0.0454545454545455 | OK |