Free Statistics

of Irreproducible Research!

Author's title

Author*The author of this computation has been verified*
R Software Modulerwasp_multipleregression.wasp
Title produced by softwareMultiple Regression
Date of computationThu, 24 Nov 2011 06:33:07 -0500
Cite this page as followsStatistical Computations at FreeStatistics.org, Office for Research Development and Education, URL https://freestatistics.org/blog/index.php?v=date/2011/Nov/24/t1322134411dr8enafnh80qkb8.htm/, Retrieved Thu, 25 Apr 2024 09:39:37 +0000
Statistical Computations at FreeStatistics.org, Office for Research Development and Education, URL https://freestatistics.org/blog/index.php?pk=146621, Retrieved Thu, 25 Apr 2024 09:39:37 +0000
QR Codes:

Original text written by user:
IsPrivate?No (this computation is public)
User-defined keywords
Estimated Impact145
Family? (F = Feedback message, R = changed R code, M = changed R Module, P = changed Parameters, D = changed Data)
-       [Multiple Regression] [le-ppt-ppp] [2011-11-24 11:33:07] [e524eb56e6915a531809c7eb50783bc6] [Current]
Feedback Forum

Post a new message
Dataseries X:
70.5	4.0	370
53.5	315.0	6166
65.0	4.0	684
76.5	1.7	449
70.0	8.0	643
71.0	5.6	1551
60.5	15.0	616
51.5	503.0	36660
78.0	2.6	403
76.0	2.6	346
57.5	44.0	2471
61.0	24.0	7427
64.5	23.0	2992
78.5	3.8	233
79.0	1.8	609
61.0	96.0	7615
70.0	90.0	370
70.0	4.9	1066
72.0	6.6	600
64.5	21.0	4873
54.5	592.0	3485
56.5	73.0	2364
64.5	14.0	1016
64.5	8.8	1062
73.0	3.9	480
72.0	6.0	559
69.0	3.2	259
64.0	11.0	1340
78.5	2.6	275
53.0	23.0	12550
75.0	3.2	965
68.5	11.0	4883
70.0	5.0	1189
70.5	3.0	226
76.0	3.0	611
75.5	1.3	404
74.5	5.6	576
65.0	29.0	3096


Summary of computational transaction
Raw Inputview raw input (R code)
Raw Outputview raw output of R engine
Computing time4 seconds
R Server'Gertrude Mary Cox' @ cox.wessa.net

\begin{tabular}{lllllllll}
\hline
Summary of computational transaction \tabularnewline
Raw Input & view raw input (R code)  \tabularnewline
Raw Output & view raw output of R engine  \tabularnewline
Computing time & 4 seconds \tabularnewline
R Server & 'Gertrude Mary Cox' @ cox.wessa.net \tabularnewline
\hline
\end{tabular}
%Source: https://freestatistics.org/blog/index.php?pk=146621&T=0

[TABLE]
[ROW][C]Summary of computational transaction[/C][/ROW]
[ROW][C]Raw Input[/C][C]view raw input (R code) [/C][/ROW]
[ROW][C]Raw Output[/C][C]view raw output of R engine [/C][/ROW]
[ROW][C]Computing time[/C][C]4 seconds[/C][/ROW]
[ROW][C]R Server[/C][C]'Gertrude Mary Cox' @ cox.wessa.net[/C][/ROW]
[/TABLE]
Source: https://freestatistics.org/blog/index.php?pk=146621&T=0

Globally Unique Identifier (entire table): ba.freestatistics.org/blog/index.php?pk=146621&T=0

As an alternative you can also use a QR Code:  

The GUIDs for individual cells are displayed in the table below:

Summary of computational transaction
Raw Inputview raw input (R code)
Raw Outputview raw output of R engine
Computing time4 seconds
R Server'Gertrude Mary Cox' @ cox.wessa.net


Multiple Linear Regression - Estimated Regression Equation
le[t] = + 69.4869388743821 -0.022948018631255ppt[t] -0.000429261628844959ppp[t] + 0.0373536472389814t + e[t]

\begin{tabular}{lllllllll}
\hline
Multiple Linear Regression - Estimated Regression Equation \tabularnewline
le[t] =  +  69.4869388743821 -0.022948018631255ppt[t] -0.000429261628844959ppp[t] +  0.0373536472389814t  + e[t] \tabularnewline
\hline
\end{tabular}
%Source: https://freestatistics.org/blog/index.php?pk=146621&T=1

[TABLE]
[ROW][C]Multiple Linear Regression - Estimated Regression Equation[/C][/ROW]
[ROW][C]le[t] =  +  69.4869388743821 -0.022948018631255ppt[t] -0.000429261628844959ppp[t] +  0.0373536472389814t  + e[t][/C][/ROW]
[/TABLE]
Source: https://freestatistics.org/blog/index.php?pk=146621&T=1

Globally Unique Identifier (entire table): ba.freestatistics.org/blog/index.php?pk=146621&T=1

As an alternative you can also use a QR Code:  

The GUIDs for individual cells are displayed in the table below:

Multiple Linear Regression - Estimated Regression Equation
le[t] = + 69.4869388743821 -0.022948018631255ppt[t] -0.000429261628844959ppp[t] + 0.0373536472389814t + e[t]


Multiple Linear Regression - Ordinary Least Squares
VariableParameterS.D.T-STATH0: parameter = 02-tail p-value1-tail p-value
(Intercept)69.48693887438212.17769631.908500
ppt-0.0229480186312550.009856-2.32830.0259780.012989
ppp-0.0004292616288449590.000205-2.09550.0436490.021824
t0.03735364723898140.0917430.40720.6864450.343222

\begin{tabular}{lllllllll}
\hline
Multiple Linear Regression - Ordinary Least Squares \tabularnewline
Variable & Parameter & S.D. & T-STATH0: parameter = 0 & 2-tail p-value & 1-tail p-value \tabularnewline
(Intercept) & 69.4869388743821 & 2.177696 & 31.9085 & 0 & 0 \tabularnewline
ppt & -0.022948018631255 & 0.009856 & -2.3283 & 0.025978 & 0.012989 \tabularnewline
ppp & -0.000429261628844959 & 0.000205 & -2.0955 & 0.043649 & 0.021824 \tabularnewline
t & 0.0373536472389814 & 0.091743 & 0.4072 & 0.686445 & 0.343222 \tabularnewline
\hline
\end{tabular}
%Source: https://freestatistics.org/blog/index.php?pk=146621&T=2

[TABLE]
[ROW][C]Multiple Linear Regression - Ordinary Least Squares[/C][/ROW]
[ROW][C]Variable[/C][C]Parameter[/C][C]S.D.[/C][C]T-STATH0: parameter = 0[/C][C]2-tail p-value[/C][C]1-tail p-value[/C][/ROW]
[ROW][C](Intercept)[/C][C]69.4869388743821[/C][C]2.177696[/C][C]31.9085[/C][C]0[/C][C]0[/C][/ROW]
[ROW][C]ppt[/C][C]-0.022948018631255[/C][C]0.009856[/C][C]-2.3283[/C][C]0.025978[/C][C]0.012989[/C][/ROW]
[ROW][C]ppp[/C][C]-0.000429261628844959[/C][C]0.000205[/C][C]-2.0955[/C][C]0.043649[/C][C]0.021824[/C][/ROW]
[ROW][C]t[/C][C]0.0373536472389814[/C][C]0.091743[/C][C]0.4072[/C][C]0.686445[/C][C]0.343222[/C][/ROW]
[/TABLE]
Source: https://freestatistics.org/blog/index.php?pk=146621&T=2

Globally Unique Identifier (entire table): ba.freestatistics.org/blog/index.php?pk=146621&T=2

As an alternative you can also use a QR Code:  

The GUIDs for individual cells are displayed in the table below:

Multiple Linear Regression - Ordinary Least Squares
VariableParameterS.D.T-STATH0: parameter = 02-tail p-value1-tail p-value
(Intercept)69.48693887438212.17769631.908500
ppt-0.0229480186312550.009856-2.32830.0259780.012989
ppp-0.0004292616288449590.000205-2.09550.0436490.021824
t0.03735364723898140.0917430.40720.6864450.343222


Multiple Linear Regression - Regression Statistics
Multiple R0.665397051711698
R-squared0.44275323642662
Adjusted R-squared0.393584404346615
F-TEST (value)9.00475398126606
F-TEST (DF numerator)3
F-TEST (DF denominator)34
p-value0.000157558926747292
Multiple Linear Regression - Residual Statistics
Residual Standard Deviation6.07580789352442
Sum Squared Residuals1255.12501300646

\begin{tabular}{lllllllll}
\hline
Multiple Linear Regression - Regression Statistics \tabularnewline
Multiple R & 0.665397051711698 \tabularnewline
R-squared & 0.44275323642662 \tabularnewline
Adjusted R-squared & 0.393584404346615 \tabularnewline
F-TEST (value) & 9.00475398126606 \tabularnewline
F-TEST (DF numerator) & 3 \tabularnewline
F-TEST (DF denominator) & 34 \tabularnewline
p-value & 0.000157558926747292 \tabularnewline
Multiple Linear Regression - Residual Statistics \tabularnewline
Residual Standard Deviation & 6.07580789352442 \tabularnewline
Sum Squared Residuals & 1255.12501300646 \tabularnewline
\hline
\end{tabular}
%Source: https://freestatistics.org/blog/index.php?pk=146621&T=3

[TABLE]
[ROW][C]Multiple Linear Regression - Regression Statistics[/C][/ROW]
[ROW][C]Multiple R[/C][C]0.665397051711698[/C][/ROW]
[ROW][C]R-squared[/C][C]0.44275323642662[/C][/ROW]
[ROW][C]Adjusted R-squared[/C][C]0.393584404346615[/C][/ROW]
[ROW][C]F-TEST (value)[/C][C]9.00475398126606[/C][/ROW]
[ROW][C]F-TEST (DF numerator)[/C][C]3[/C][/ROW]
[ROW][C]F-TEST (DF denominator)[/C][C]34[/C][/ROW]
[ROW][C]p-value[/C][C]0.000157558926747292[/C][/ROW]
[ROW][C]Multiple Linear Regression - Residual Statistics[/C][/ROW]
[ROW][C]Residual Standard Deviation[/C][C]6.07580789352442[/C][/ROW]
[ROW][C]Sum Squared Residuals[/C][C]1255.12501300646[/C][/ROW]
[/TABLE]
Source: https://freestatistics.org/blog/index.php?pk=146621&T=3

Globally Unique Identifier (entire table): ba.freestatistics.org/blog/index.php?pk=146621&T=3

As an alternative you can also use a QR Code:  

The GUIDs for individual cells are displayed in the table below:

Multiple Linear Regression - Regression Statistics
Multiple R0.665397051711698
R-squared0.44275323642662
Adjusted R-squared0.393584404346615
F-TEST (value)9.00475398126606
F-TEST (DF numerator)3
F-TEST (DF denominator)34
p-value0.000157558926747292
Multiple Linear Regression - Residual Statistics
Residual Standard Deviation6.07580789352442
Sum Squared Residuals1255.12501300646


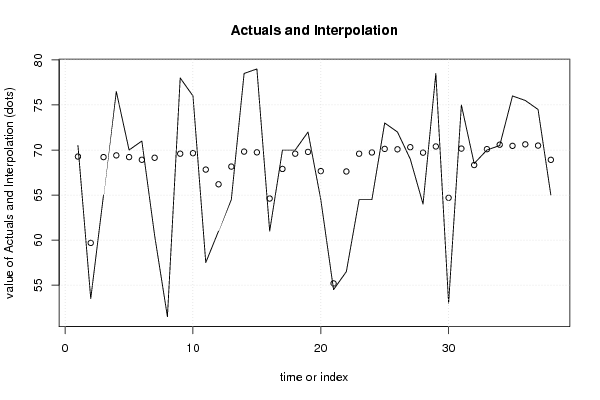
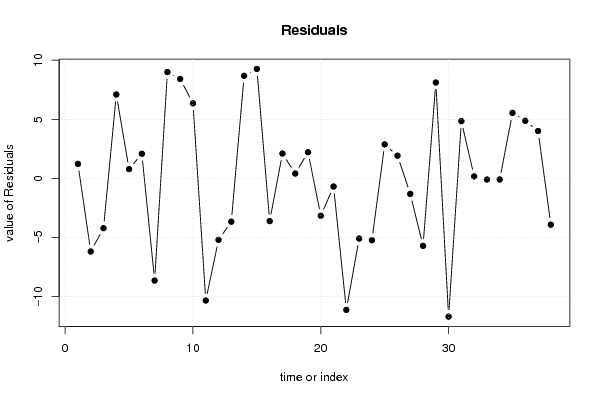
Multiple Linear Regression - Actuals, Interpolation, and Residuals
Time or IndexActualsInterpolationForecastResidualsPrediction Error
170.569.27367364442341.22632635557662
253.559.6861930965568-6.18619309655676
36569.2135927874441-4.21359278744411
476.569.40460336031357.09539663968646
57069.21410773417970.785892265820307
67168.91676706714252.08323293285754
760.569.1397689622177-8.63976896221768
851.542.50618336731658.99381663268346
97869.59046441466728.40953558533282
107669.65228597475036.34771402524967
1157.567.8274106893598-10.3274106893598
126166.1963040766683-5.19630407666828
1364.568.1603810664659-3.66038106646591
1478.569.82266950540828.67733049459177
157969.7445168174649.25548318253599
166164.612760137951-3.612760137951
177067.89780239795922.10219760204077
187069.58926633704190.410733662958077
197269.78764427164952.21235572835048
2064.567.6603115105439-3.16031151054392
2154.555.1901616601731-0.690161660173113
2256.567.6187392629686-11.1187392629686
2364.569.5886706851347-5.08867068513466
2464.569.7256079943293-5.2256079943293
257370.12523720084922.87476279915081
267270.08048834028381.91951165971621
276970.3108749283438-1.31087492834377
286469.7052022094776-5.70520220947756
2978.570.3924828479398.10751715206103
305364.6925104210285-11.6925104210285
317570.15723080733524.84276919266484
3268.568.33374284743580.1662571525642
337070.0944770634156-0.0944770634155886
3470.570.5911056964948-0.091105696494775
357670.46319361662845.53680638337155
3675.570.62841605271154.87158394728853
3774.570.49326021967474.00673978032528
386568.911890926253-3.91189092625304

\begin{tabular}{lllllllll}
\hline
Multiple Linear Regression - Actuals, Interpolation, and Residuals \tabularnewline
Time or Index & Actuals & InterpolationForecast & ResidualsPrediction Error \tabularnewline
1 & 70.5 & 69.2736736444234 & 1.22632635557662 \tabularnewline
2 & 53.5 & 59.6861930965568 & -6.18619309655676 \tabularnewline
3 & 65 & 69.2135927874441 & -4.21359278744411 \tabularnewline
4 & 76.5 & 69.4046033603135 & 7.09539663968646 \tabularnewline
5 & 70 & 69.2141077341797 & 0.785892265820307 \tabularnewline
6 & 71 & 68.9167670671425 & 2.08323293285754 \tabularnewline
7 & 60.5 & 69.1397689622177 & -8.63976896221768 \tabularnewline
8 & 51.5 & 42.5061833673165 & 8.99381663268346 \tabularnewline
9 & 78 & 69.5904644146672 & 8.40953558533282 \tabularnewline
10 & 76 & 69.6522859747503 & 6.34771402524967 \tabularnewline
11 & 57.5 & 67.8274106893598 & -10.3274106893598 \tabularnewline
12 & 61 & 66.1963040766683 & -5.19630407666828 \tabularnewline
13 & 64.5 & 68.1603810664659 & -3.66038106646591 \tabularnewline
14 & 78.5 & 69.8226695054082 & 8.67733049459177 \tabularnewline
15 & 79 & 69.744516817464 & 9.25548318253599 \tabularnewline
16 & 61 & 64.612760137951 & -3.612760137951 \tabularnewline
17 & 70 & 67.8978023979592 & 2.10219760204077 \tabularnewline
18 & 70 & 69.5892663370419 & 0.410733662958077 \tabularnewline
19 & 72 & 69.7876442716495 & 2.21235572835048 \tabularnewline
20 & 64.5 & 67.6603115105439 & -3.16031151054392 \tabularnewline
21 & 54.5 & 55.1901616601731 & -0.690161660173113 \tabularnewline
22 & 56.5 & 67.6187392629686 & -11.1187392629686 \tabularnewline
23 & 64.5 & 69.5886706851347 & -5.08867068513466 \tabularnewline
24 & 64.5 & 69.7256079943293 & -5.2256079943293 \tabularnewline
25 & 73 & 70.1252372008492 & 2.87476279915081 \tabularnewline
26 & 72 & 70.0804883402838 & 1.91951165971621 \tabularnewline
27 & 69 & 70.3108749283438 & -1.31087492834377 \tabularnewline
28 & 64 & 69.7052022094776 & -5.70520220947756 \tabularnewline
29 & 78.5 & 70.392482847939 & 8.10751715206103 \tabularnewline
30 & 53 & 64.6925104210285 & -11.6925104210285 \tabularnewline
31 & 75 & 70.1572308073352 & 4.84276919266484 \tabularnewline
32 & 68.5 & 68.3337428474358 & 0.1662571525642 \tabularnewline
33 & 70 & 70.0944770634156 & -0.0944770634155886 \tabularnewline
34 & 70.5 & 70.5911056964948 & -0.091105696494775 \tabularnewline
35 & 76 & 70.4631936166284 & 5.53680638337155 \tabularnewline
36 & 75.5 & 70.6284160527115 & 4.87158394728853 \tabularnewline
37 & 74.5 & 70.4932602196747 & 4.00673978032528 \tabularnewline
38 & 65 & 68.911890926253 & -3.91189092625304 \tabularnewline
\hline
\end{tabular}
%Source: https://freestatistics.org/blog/index.php?pk=146621&T=4

[TABLE]
[ROW][C]Multiple Linear Regression - Actuals, Interpolation, and Residuals[/C][/ROW]
[ROW][C]Time or Index[/C][C]Actuals[/C][C]InterpolationForecast[/C][C]ResidualsPrediction Error[/C][/ROW]
[ROW][C]1[/C][C]70.5[/C][C]69.2736736444234[/C][C]1.22632635557662[/C][/ROW]
[ROW][C]2[/C][C]53.5[/C][C]59.6861930965568[/C][C]-6.18619309655676[/C][/ROW]
[ROW][C]3[/C][C]65[/C][C]69.2135927874441[/C][C]-4.21359278744411[/C][/ROW]
[ROW][C]4[/C][C]76.5[/C][C]69.4046033603135[/C][C]7.09539663968646[/C][/ROW]
[ROW][C]5[/C][C]70[/C][C]69.2141077341797[/C][C]0.785892265820307[/C][/ROW]
[ROW][C]6[/C][C]71[/C][C]68.9167670671425[/C][C]2.08323293285754[/C][/ROW]
[ROW][C]7[/C][C]60.5[/C][C]69.1397689622177[/C][C]-8.63976896221768[/C][/ROW]
[ROW][C]8[/C][C]51.5[/C][C]42.5061833673165[/C][C]8.99381663268346[/C][/ROW]
[ROW][C]9[/C][C]78[/C][C]69.5904644146672[/C][C]8.40953558533282[/C][/ROW]
[ROW][C]10[/C][C]76[/C][C]69.6522859747503[/C][C]6.34771402524967[/C][/ROW]
[ROW][C]11[/C][C]57.5[/C][C]67.8274106893598[/C][C]-10.3274106893598[/C][/ROW]
[ROW][C]12[/C][C]61[/C][C]66.1963040766683[/C][C]-5.19630407666828[/C][/ROW]
[ROW][C]13[/C][C]64.5[/C][C]68.1603810664659[/C][C]-3.66038106646591[/C][/ROW]
[ROW][C]14[/C][C]78.5[/C][C]69.8226695054082[/C][C]8.67733049459177[/C][/ROW]
[ROW][C]15[/C][C]79[/C][C]69.744516817464[/C][C]9.25548318253599[/C][/ROW]
[ROW][C]16[/C][C]61[/C][C]64.612760137951[/C][C]-3.612760137951[/C][/ROW]
[ROW][C]17[/C][C]70[/C][C]67.8978023979592[/C][C]2.10219760204077[/C][/ROW]
[ROW][C]18[/C][C]70[/C][C]69.5892663370419[/C][C]0.410733662958077[/C][/ROW]
[ROW][C]19[/C][C]72[/C][C]69.7876442716495[/C][C]2.21235572835048[/C][/ROW]
[ROW][C]20[/C][C]64.5[/C][C]67.6603115105439[/C][C]-3.16031151054392[/C][/ROW]
[ROW][C]21[/C][C]54.5[/C][C]55.1901616601731[/C][C]-0.690161660173113[/C][/ROW]
[ROW][C]22[/C][C]56.5[/C][C]67.6187392629686[/C][C]-11.1187392629686[/C][/ROW]
[ROW][C]23[/C][C]64.5[/C][C]69.5886706851347[/C][C]-5.08867068513466[/C][/ROW]
[ROW][C]24[/C][C]64.5[/C][C]69.7256079943293[/C][C]-5.2256079943293[/C][/ROW]
[ROW][C]25[/C][C]73[/C][C]70.1252372008492[/C][C]2.87476279915081[/C][/ROW]
[ROW][C]26[/C][C]72[/C][C]70.0804883402838[/C][C]1.91951165971621[/C][/ROW]
[ROW][C]27[/C][C]69[/C][C]70.3108749283438[/C][C]-1.31087492834377[/C][/ROW]
[ROW][C]28[/C][C]64[/C][C]69.7052022094776[/C][C]-5.70520220947756[/C][/ROW]
[ROW][C]29[/C][C]78.5[/C][C]70.392482847939[/C][C]8.10751715206103[/C][/ROW]
[ROW][C]30[/C][C]53[/C][C]64.6925104210285[/C][C]-11.6925104210285[/C][/ROW]
[ROW][C]31[/C][C]75[/C][C]70.1572308073352[/C][C]4.84276919266484[/C][/ROW]
[ROW][C]32[/C][C]68.5[/C][C]68.3337428474358[/C][C]0.1662571525642[/C][/ROW]
[ROW][C]33[/C][C]70[/C][C]70.0944770634156[/C][C]-0.0944770634155886[/C][/ROW]
[ROW][C]34[/C][C]70.5[/C][C]70.5911056964948[/C][C]-0.091105696494775[/C][/ROW]
[ROW][C]35[/C][C]76[/C][C]70.4631936166284[/C][C]5.53680638337155[/C][/ROW]
[ROW][C]36[/C][C]75.5[/C][C]70.6284160527115[/C][C]4.87158394728853[/C][/ROW]
[ROW][C]37[/C][C]74.5[/C][C]70.4932602196747[/C][C]4.00673978032528[/C][/ROW]
[ROW][C]38[/C][C]65[/C][C]68.911890926253[/C][C]-3.91189092625304[/C][/ROW]
[/TABLE]
Source: https://freestatistics.org/blog/index.php?pk=146621&T=4

Globally Unique Identifier (entire table): ba.freestatistics.org/blog/index.php?pk=146621&T=4

As an alternative you can also use a QR Code:  

The GUIDs for individual cells are displayed in the table below:

Multiple Linear Regression - Actuals, Interpolation, and Residuals
Time or IndexActualsInterpolationForecastResidualsPrediction Error
170.569.27367364442341.22632635557662
253.559.6861930965568-6.18619309655676
36569.2135927874441-4.21359278744411
476.569.40460336031357.09539663968646
57069.21410773417970.785892265820307
67168.91676706714252.08323293285754
760.569.1397689622177-8.63976896221768
851.542.50618336731658.99381663268346
97869.59046441466728.40953558533282
107669.65228597475036.34771402524967
1157.567.8274106893598-10.3274106893598
126166.1963040766683-5.19630407666828
1364.568.1603810664659-3.66038106646591
1478.569.82266950540828.67733049459177
157969.7445168174649.25548318253599
166164.612760137951-3.612760137951
177067.89780239795922.10219760204077
187069.58926633704190.410733662958077
197269.78764427164952.21235572835048
2064.567.6603115105439-3.16031151054392
2154.555.1901616601731-0.690161660173113
2256.567.6187392629686-11.1187392629686
2364.569.5886706851347-5.08867068513466
2464.569.7256079943293-5.2256079943293
257370.12523720084922.87476279915081
267270.08048834028381.91951165971621
276970.3108749283438-1.31087492834377
286469.7052022094776-5.70520220947756
2978.570.3924828479398.10751715206103
305364.6925104210285-11.6925104210285
317570.15723080733524.84276919266484
3268.568.33374284743580.1662571525642
337070.0944770634156-0.0944770634155886
3470.570.5911056964948-0.091105696494775
357670.46319361662845.53680638337155
3675.570.62841605271154.87158394728853
3774.570.49326021967474.00673978032528
386568.911890926253-3.91189092625304


Goldfeld-Quandt test for Heteroskedasticity
p-valuesAlternative Hypothesis
breakpoint indexgreater2-sidedless
70.5743438940233960.8513122119532090.425656105976604
80.6911249682156910.6177500635686170.308875031784309
90.8349698495308910.3300603009382180.165030150469109
100.7813340686085430.4373318627829140.218665931391457
110.9523188611319860.09536227773602770.0476811388680139
120.9502122236283970.09957555274320520.0497877763716026
130.9195221431809950.1609557136380110.0804778568190053
140.964774685296580.07045062940684010.0352253147034201
150.9856340322958020.02873193540839550.0143659677041978
160.9847336380881330.03053272382373480.0152663619118674
170.9756994264388420.04860114712231680.0243005735611584
180.9609141524891790.07817169502164130.0390858475108207
190.9502940318721430.09941193625571480.0497059681278574
200.9487146971994110.1025706056011770.0512853028005886
210.9872083207969710.02558335840605740.0127916792030287
220.9953071176018010.009385764796398130.00469288239819906
230.9899222596778550.02015548064429020.0100777403221451
240.9855091531954060.02898169360918760.0144908468045938
250.9757075695636710.04858486087265810.0242924304363291
260.9593348620822820.08133027583543540.0406651379177177
270.9309093515843060.1381812968313870.0690906484156937
280.9714724001548270.05705519969034640.0285275998451732
290.9677078735381740.06458425292365170.0322921264618259
300.9546138694895620.09077226102087680.0453861305104384
310.9805436393271770.03891272134564510.0194563606728226

\begin{tabular}{lllllllll}
\hline
Goldfeld-Quandt test for Heteroskedasticity \tabularnewline
p-values & Alternative Hypothesis \tabularnewline
breakpoint index & greater & 2-sided & less \tabularnewline
7 & 0.574343894023396 & 0.851312211953209 & 0.425656105976604 \tabularnewline
8 & 0.691124968215691 & 0.617750063568617 & 0.308875031784309 \tabularnewline
9 & 0.834969849530891 & 0.330060300938218 & 0.165030150469109 \tabularnewline
10 & 0.781334068608543 & 0.437331862782914 & 0.218665931391457 \tabularnewline
11 & 0.952318861131986 & 0.0953622777360277 & 0.0476811388680139 \tabularnewline
12 & 0.950212223628397 & 0.0995755527432052 & 0.0497877763716026 \tabularnewline
13 & 0.919522143180995 & 0.160955713638011 & 0.0804778568190053 \tabularnewline
14 & 0.96477468529658 & 0.0704506294068401 & 0.0352253147034201 \tabularnewline
15 & 0.985634032295802 & 0.0287319354083955 & 0.0143659677041978 \tabularnewline
16 & 0.984733638088133 & 0.0305327238237348 & 0.0152663619118674 \tabularnewline
17 & 0.975699426438842 & 0.0486011471223168 & 0.0243005735611584 \tabularnewline
18 & 0.960914152489179 & 0.0781716950216413 & 0.0390858475108207 \tabularnewline
19 & 0.950294031872143 & 0.0994119362557148 & 0.0497059681278574 \tabularnewline
20 & 0.948714697199411 & 0.102570605601177 & 0.0512853028005886 \tabularnewline
21 & 0.987208320796971 & 0.0255833584060574 & 0.0127916792030287 \tabularnewline
22 & 0.995307117601801 & 0.00938576479639813 & 0.00469288239819906 \tabularnewline
23 & 0.989922259677855 & 0.0201554806442902 & 0.0100777403221451 \tabularnewline
24 & 0.985509153195406 & 0.0289816936091876 & 0.0144908468045938 \tabularnewline
25 & 0.975707569563671 & 0.0485848608726581 & 0.0242924304363291 \tabularnewline
26 & 0.959334862082282 & 0.0813302758354354 & 0.0406651379177177 \tabularnewline
27 & 0.930909351584306 & 0.138181296831387 & 0.0690906484156937 \tabularnewline
28 & 0.971472400154827 & 0.0570551996903464 & 0.0285275998451732 \tabularnewline
29 & 0.967707873538174 & 0.0645842529236517 & 0.0322921264618259 \tabularnewline
30 & 0.954613869489562 & 0.0907722610208768 & 0.0453861305104384 \tabularnewline
31 & 0.980543639327177 & 0.0389127213456451 & 0.0194563606728226 \tabularnewline
\hline
\end{tabular}
%Source: https://freestatistics.org/blog/index.php?pk=146621&T=5

[TABLE]
[ROW][C]Goldfeld-Quandt test for Heteroskedasticity[/C][/ROW]
[ROW][C]p-values[/C][C]Alternative Hypothesis[/C][/ROW]
[ROW][C]breakpoint index[/C][C]greater[/C][C]2-sided[/C][C]less[/C][/ROW]
[ROW][C]7[/C][C]0.574343894023396[/C][C]0.851312211953209[/C][C]0.425656105976604[/C][/ROW]
[ROW][C]8[/C][C]0.691124968215691[/C][C]0.617750063568617[/C][C]0.308875031784309[/C][/ROW]
[ROW][C]9[/C][C]0.834969849530891[/C][C]0.330060300938218[/C][C]0.165030150469109[/C][/ROW]
[ROW][C]10[/C][C]0.781334068608543[/C][C]0.437331862782914[/C][C]0.218665931391457[/C][/ROW]
[ROW][C]11[/C][C]0.952318861131986[/C][C]0.0953622777360277[/C][C]0.0476811388680139[/C][/ROW]
[ROW][C]12[/C][C]0.950212223628397[/C][C]0.0995755527432052[/C][C]0.0497877763716026[/C][/ROW]
[ROW][C]13[/C][C]0.919522143180995[/C][C]0.160955713638011[/C][C]0.0804778568190053[/C][/ROW]
[ROW][C]14[/C][C]0.96477468529658[/C][C]0.0704506294068401[/C][C]0.0352253147034201[/C][/ROW]
[ROW][C]15[/C][C]0.985634032295802[/C][C]0.0287319354083955[/C][C]0.0143659677041978[/C][/ROW]
[ROW][C]16[/C][C]0.984733638088133[/C][C]0.0305327238237348[/C][C]0.0152663619118674[/C][/ROW]
[ROW][C]17[/C][C]0.975699426438842[/C][C]0.0486011471223168[/C][C]0.0243005735611584[/C][/ROW]
[ROW][C]18[/C][C]0.960914152489179[/C][C]0.0781716950216413[/C][C]0.0390858475108207[/C][/ROW]
[ROW][C]19[/C][C]0.950294031872143[/C][C]0.0994119362557148[/C][C]0.0497059681278574[/C][/ROW]
[ROW][C]20[/C][C]0.948714697199411[/C][C]0.102570605601177[/C][C]0.0512853028005886[/C][/ROW]
[ROW][C]21[/C][C]0.987208320796971[/C][C]0.0255833584060574[/C][C]0.0127916792030287[/C][/ROW]
[ROW][C]22[/C][C]0.995307117601801[/C][C]0.00938576479639813[/C][C]0.00469288239819906[/C][/ROW]
[ROW][C]23[/C][C]0.989922259677855[/C][C]0.0201554806442902[/C][C]0.0100777403221451[/C][/ROW]
[ROW][C]24[/C][C]0.985509153195406[/C][C]0.0289816936091876[/C][C]0.0144908468045938[/C][/ROW]
[ROW][C]25[/C][C]0.975707569563671[/C][C]0.0485848608726581[/C][C]0.0242924304363291[/C][/ROW]
[ROW][C]26[/C][C]0.959334862082282[/C][C]0.0813302758354354[/C][C]0.0406651379177177[/C][/ROW]
[ROW][C]27[/C][C]0.930909351584306[/C][C]0.138181296831387[/C][C]0.0690906484156937[/C][/ROW]
[ROW][C]28[/C][C]0.971472400154827[/C][C]0.0570551996903464[/C][C]0.0285275998451732[/C][/ROW]
[ROW][C]29[/C][C]0.967707873538174[/C][C]0.0645842529236517[/C][C]0.0322921264618259[/C][/ROW]
[ROW][C]30[/C][C]0.954613869489562[/C][C]0.0907722610208768[/C][C]0.0453861305104384[/C][/ROW]
[ROW][C]31[/C][C]0.980543639327177[/C][C]0.0389127213456451[/C][C]0.0194563606728226[/C][/ROW]
[/TABLE]
Source: https://freestatistics.org/blog/index.php?pk=146621&T=5

Globally Unique Identifier (entire table): ba.freestatistics.org/blog/index.php?pk=146621&T=5

As an alternative you can also use a QR Code:  

The GUIDs for individual cells are displayed in the table below:

Goldfeld-Quandt test for Heteroskedasticity
p-valuesAlternative Hypothesis
breakpoint indexgreater2-sidedless
70.5743438940233960.8513122119532090.425656105976604
80.6911249682156910.6177500635686170.308875031784309
90.8349698495308910.3300603009382180.165030150469109
100.7813340686085430.4373318627829140.218665931391457
110.9523188611319860.09536227773602770.0476811388680139
120.9502122236283970.09957555274320520.0497877763716026
130.9195221431809950.1609557136380110.0804778568190053
140.964774685296580.07045062940684010.0352253147034201
150.9856340322958020.02873193540839550.0143659677041978
160.9847336380881330.03053272382373480.0152663619118674
170.9756994264388420.04860114712231680.0243005735611584
180.9609141524891790.07817169502164130.0390858475108207
190.9502940318721430.09941193625571480.0497059681278574
200.9487146971994110.1025706056011770.0512853028005886
210.9872083207969710.02558335840605740.0127916792030287
220.9953071176018010.009385764796398130.00469288239819906
230.9899222596778550.02015548064429020.0100777403221451
240.9855091531954060.02898169360918760.0144908468045938
250.9757075695636710.04858486087265810.0242924304363291
260.9593348620822820.08133027583543540.0406651379177177
270.9309093515843060.1381812968313870.0690906484156937
280.9714724001548270.05705519969034640.0285275998451732
290.9677078735381740.06458425292365170.0322921264618259
300.9546138694895620.09077226102087680.0453861305104384
310.9805436393271770.03891272134564510.0194563606728226


Meta Analysis of Goldfeld-Quandt test for Heteroskedasticity
Description# significant tests% significant testsOK/NOK
1% type I error level10.04NOK
5% type I error level90.36NOK
10% type I error level180.72NOK

\begin{tabular}{lllllllll}
\hline
Meta Analysis of Goldfeld-Quandt test for Heteroskedasticity \tabularnewline
Description & # significant tests & % significant tests & OK/NOK \tabularnewline
1% type I error level & 1 & 0.04 & NOK \tabularnewline
5% type I error level & 9 & 0.36 & NOK \tabularnewline
10% type I error level & 18 & 0.72 & NOK \tabularnewline
\hline
\end{tabular}
%Source: https://freestatistics.org/blog/index.php?pk=146621&T=6

[TABLE]
[ROW][C]Meta Analysis of Goldfeld-Quandt test for Heteroskedasticity[/C][/ROW]
[ROW][C]Description[/C][C]# significant tests[/C][C]% significant tests[/C][C]OK/NOK[/C][/ROW]
[ROW][C]1% type I error level[/C][C]1[/C][C]0.04[/C][C]NOK[/C][/ROW]
[ROW][C]5% type I error level[/C][C]9[/C][C]0.36[/C][C]NOK[/C][/ROW]
[ROW][C]10% type I error level[/C][C]18[/C][C]0.72[/C][C]NOK[/C][/ROW]
[/TABLE]
Source: https://freestatistics.org/blog/index.php?pk=146621&T=6

Globally Unique Identifier (entire table): ba.freestatistics.org/blog/index.php?pk=146621&T=6

As an alternative you can also use a QR Code:  

The GUIDs for individual cells are displayed in the table below:

Meta Analysis of Goldfeld-Quandt test for Heteroskedasticity
Description# significant tests% significant testsOK/NOK
1% type I error level10.04NOK
5% type I error level90.36NOK
10% type I error level180.72NOK


Parameters (Session):
par1 = 1 ; par2 = Do not include Seasonal Dummies ; par3 = Linear Trend ;
Parameters (R input):
par1 = 1 ; par2 = Do not include Seasonal Dummies ; par3 = Linear Trend ;
R code (references can be found in the software module):
library(lattice)
library(lmtest)
n25 <- 25 #minimum number of obs. for Goldfeld-Quandt test
par1 <- as.numeric(par1)
x <- t(y)
k <- length(x[1,])
n <- length(x[,1])
x1 <- cbind(x[,par1], x[,1:k!=par1])
mycolnames <- c(colnames(x)[par1], colnames(x)[1:k!=par1])
colnames(x1) <- mycolnames #colnames(x)[par1]
x <- x1
if (par3 == 'First Differences'){
x2 <- array(0, dim=c(n-1,k), dimnames=list(1:(n-1), paste('(1-B)',colnames(x),sep='')))
for (i in 1:n-1) {
for (j in 1:k) {
x2[i,j] <- x[i+1,j] - x[i,j]
}
}
x <- x2
}
if (par2 == 'Include Monthly Dummies'){
x2 <- array(0, dim=c(n,11), dimnames=list(1:n, paste('M', seq(1:11), sep ='')))
for (i in 1:11){
x2[seq(i,n,12),i] <- 1
}
x <- cbind(x, x2)
}
if (par2 == 'Include Quarterly Dummies'){
x2 <- array(0, dim=c(n,3), dimnames=list(1:n, paste('Q', seq(1:3), sep ='')))
for (i in 1:3){
x2[seq(i,n,4),i] <- 1
}
x <- cbind(x, x2)
}
k <- length(x[1,])
if (par3 == 'Linear Trend'){
x <- cbind(x, c(1:n))
colnames(x)[k+1] <- 't'
}
x
k <- length(x[1,])
df <- as.data.frame(x)
(mylm <- lm(df))
(mysum <- summary(mylm))
if (n > n25) {
kp3 <- k + 3
nmkm3 <- n - k - 3
gqarr <- array(NA, dim=c(nmkm3-kp3+1,3))
numgqtests <- 0
numsignificant1 <- 0
numsignificant5 <- 0
numsignificant10 <- 0
for (mypoint in kp3:nmkm3) {
j <- 0
numgqtests <- numgqtests + 1
for (myalt in c('greater', 'two.sided', 'less')) {
j <- j + 1
gqarr[mypoint-kp3+1,j] <- gqtest(mylm, point=mypoint, alternative=myalt)$p.value
}
if (gqarr[mypoint-kp3+1,2] < 0.01) numsignificant1 <- numsignificant1 + 1
if (gqarr[mypoint-kp3+1,2] < 0.05) numsignificant5 <- numsignificant5 + 1
if (gqarr[mypoint-kp3+1,2] < 0.10) numsignificant10 <- numsignificant10 + 1
}
gqarr
}
bitmap(file='test0.png')
plot(x[,1], type='l', main='Actuals and Interpolation', ylab='value of Actuals and Interpolation (dots)', xlab='time or index')
points(x[,1]-mysum$resid)
grid()
dev.off()
bitmap(file='test1.png')
plot(mysum$resid, type='b', pch=19, main='Residuals', ylab='value of Residuals', xlab='time or index')
grid()
dev.off()
bitmap(file='test2.png')
hist(mysum$resid, main='Residual Histogram', xlab='values of Residuals')
grid()
dev.off()
bitmap(file='test3.png')
densityplot(~mysum$resid,col='black',main='Residual Density Plot', xlab='values of Residuals')
dev.off()
bitmap(file='test4.png')
qqnorm(mysum$resid, main='Residual Normal Q-Q Plot')
qqline(mysum$resid)
grid()
dev.off()
(myerror <- as.ts(mysum$resid))
bitmap(file='test5.png')
dum <- cbind(lag(myerror,k=1),myerror)
dum
dum1 <- dum[2:length(myerror),]
dum1
z <- as.data.frame(dum1)
z
plot(z,main=paste('Residual Lag plot, lowess, and regression line'), ylab='values of Residuals', xlab='lagged values of Residuals')
lines(lowess(z))
abline(lm(z))
grid()
dev.off()
bitmap(file='test6.png')
acf(mysum$resid, lag.max=length(mysum$resid)/2, main='Residual Autocorrelation Function')
grid()
dev.off()
bitmap(file='test7.png')
pacf(mysum$resid, lag.max=length(mysum$resid)/2, main='Residual Partial Autocorrelation Function')
grid()
dev.off()
bitmap(file='test8.png')
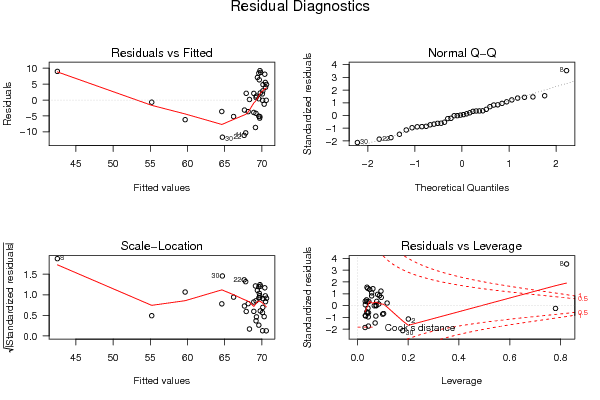
opar <- par(mfrow = c(2,2), oma = c(0, 0, 1.1, 0))
plot(mylm, las = 1, sub='Residual Diagnostics')
par(opar)
dev.off()
if (n > n25) {
bitmap(file='test9.png')
plot(kp3:nmkm3,gqarr[,2], main='Goldfeld-Quandt test',ylab='2-sided p-value',xlab='breakpoint')
grid()
dev.off()
}
load(file='createtable')
a<-table.start()
a<-table.row.start(a)
a<-table.element(a, 'Multiple Linear Regression - Estimated Regression Equation', 1, TRUE)
a<-table.row.end(a)
myeq <- colnames(x)[1]
myeq <- paste(myeq, '[t] = ', sep='')
for (i in 1:k){
if (mysum$coefficients[i,1] > 0) myeq <- paste(myeq, '+', '')
myeq <- paste(myeq, mysum$coefficients[i,1], sep=' ')
if (rownames(mysum$coefficients)[i] != '(Intercept)') {
myeq <- paste(myeq, rownames(mysum$coefficients)[i], sep='')
if (rownames(mysum$coefficients)[i] != 't') myeq <- paste(myeq, '[t]', sep='')
}
}
myeq <- paste(myeq, ' + e[t]')
a<-table.row.start(a)
a<-table.element(a, myeq)
a<-table.row.end(a)
a<-table.end(a)
table.save(a,file='mytable1.tab')
a<-table.start()
a<-table.row.start(a)
a<-table.element(a,hyperlink('ols1.htm','Multiple Linear Regression - Ordinary Least Squares',''), 6, TRUE)
a<-table.row.end(a)
a<-table.row.start(a)
a<-table.element(a,'Variable',header=TRUE)
a<-table.element(a,'Parameter',header=TRUE)
a<-table.element(a,'S.D.',header=TRUE)
a<-table.element(a,'T-STAT
H0: parameter = 0',header=TRUE)
a<-table.element(a,'2-tail p-value',header=TRUE)
a<-table.element(a,'1-tail p-value',header=TRUE)
a<-table.row.end(a)
for (i in 1:k){
a<-table.row.start(a)
a<-table.element(a,rownames(mysum$coefficients)[i],header=TRUE)
a<-table.element(a,mysum$coefficients[i,1])
a<-table.element(a, round(mysum$coefficients[i,2],6))
a<-table.element(a, round(mysum$coefficients[i,3],4))
a<-table.element(a, round(mysum$coefficients[i,4],6))
a<-table.element(a, round(mysum$coefficients[i,4]/2,6))
a<-table.row.end(a)
}
a<-table.end(a)
table.save(a,file='mytable2.tab')
a<-table.start()
a<-table.row.start(a)
a<-table.element(a, 'Multiple Linear Regression - Regression Statistics', 2, TRUE)
a<-table.row.end(a)
a<-table.row.start(a)
a<-table.element(a, 'Multiple R',1,TRUE)
a<-table.element(a, sqrt(mysum$r.squared))
a<-table.row.end(a)
a<-table.row.start(a)
a<-table.element(a, 'R-squared',1,TRUE)
a<-table.element(a, mysum$r.squared)
a<-table.row.end(a)
a<-table.row.start(a)
a<-table.element(a, 'Adjusted R-squared',1,TRUE)
a<-table.element(a, mysum$adj.r.squared)
a<-table.row.end(a)
a<-table.row.start(a)
a<-table.element(a, 'F-TEST (value)',1,TRUE)
a<-table.element(a, mysum$fstatistic[1])
a<-table.row.end(a)
a<-table.row.start(a)
a<-table.element(a, 'F-TEST (DF numerator)',1,TRUE)
a<-table.element(a, mysum$fstatistic[2])
a<-table.row.end(a)
a<-table.row.start(a)
a<-table.element(a, 'F-TEST (DF denominator)',1,TRUE)
a<-table.element(a, mysum$fstatistic[3])
a<-table.row.end(a)
a<-table.row.start(a)
a<-table.element(a, 'p-value',1,TRUE)
a<-table.element(a, 1-pf(mysum$fstatistic[1],mysum$fstatistic[2],mysum$fstatistic[3]))
a<-table.row.end(a)
a<-table.row.start(a)
a<-table.element(a, 'Multiple Linear Regression - Residual Statistics', 2, TRUE)
a<-table.row.end(a)
a<-table.row.start(a)
a<-table.element(a, 'Residual Standard Deviation',1,TRUE)
a<-table.element(a, mysum$sigma)
a<-table.row.end(a)
a<-table.row.start(a)
a<-table.element(a, 'Sum Squared Residuals',1,TRUE)
a<-table.element(a, sum(myerror*myerror))
a<-table.row.end(a)
a<-table.end(a)
table.save(a,file='mytable3.tab')
a<-table.start()
a<-table.row.start(a)
a<-table.element(a, 'Multiple Linear Regression - Actuals, Interpolation, and Residuals', 4, TRUE)
a<-table.row.end(a)
a<-table.row.start(a)
a<-table.element(a, 'Time or Index', 1, TRUE)
a<-table.element(a, 'Actuals', 1, TRUE)
a<-table.element(a, 'Interpolation
Forecast', 1, TRUE)
a<-table.element(a, 'Residuals
Prediction Error', 1, TRUE)
a<-table.row.end(a)
for (i in 1:n) {
a<-table.row.start(a)
a<-table.element(a,i, 1, TRUE)
a<-table.element(a,x[i])
a<-table.element(a,x[i]-mysum$resid[i])
a<-table.element(a,mysum$resid[i])
a<-table.row.end(a)
}
a<-table.end(a)
table.save(a,file='mytable4.tab')
if (n > n25) {
a<-table.start()
a<-table.row.start(a)
a<-table.element(a,'Goldfeld-Quandt test for Heteroskedasticity',4,TRUE)
a<-table.row.end(a)
a<-table.row.start(a)
a<-table.element(a,'p-values',header=TRUE)
a<-table.element(a,'Alternative Hypothesis',3,header=TRUE)
a<-table.row.end(a)
a<-table.row.start(a)
a<-table.element(a,'breakpoint index',header=TRUE)
a<-table.element(a,'greater',header=TRUE)
a<-table.element(a,'2-sided',header=TRUE)
a<-table.element(a,'less',header=TRUE)
a<-table.row.end(a)
for (mypoint in kp3:nmkm3) {
a<-table.row.start(a)
a<-table.element(a,mypoint,header=TRUE)
a<-table.element(a,gqarr[mypoint-kp3+1,1])
a<-table.element(a,gqarr[mypoint-kp3+1,2])
a<-table.element(a,gqarr[mypoint-kp3+1,3])
a<-table.row.end(a)
}
a<-table.end(a)
table.save(a,file='mytable5.tab')
a<-table.start()
a<-table.row.start(a)
a<-table.element(a,'Meta Analysis of Goldfeld-Quandt test for Heteroskedasticity',4,TRUE)
a<-table.row.end(a)
a<-table.row.start(a)
a<-table.element(a,'Description',header=TRUE)
a<-table.element(a,'# significant tests',header=TRUE)
a<-table.element(a,'% significant tests',header=TRUE)
a<-table.element(a,'OK/NOK',header=TRUE)
a<-table.row.end(a)
a<-table.row.start(a)
a<-table.element(a,'1% type I error level',header=TRUE)
a<-table.element(a,numsignificant1)
a<-table.element(a,numsignificant1/numgqtests)
if (numsignificant1/numgqtests < 0.01) dum <- 'OK' else dum <- 'NOK'
a<-table.element(a,dum)
a<-table.row.end(a)
a<-table.row.start(a)
a<-table.element(a,'5% type I error level',header=TRUE)
a<-table.element(a,numsignificant5)
a<-table.element(a,numsignificant5/numgqtests)
if (numsignificant5/numgqtests < 0.05) dum <- 'OK' else dum <- 'NOK'
a<-table.element(a,dum)
a<-table.row.end(a)
a<-table.row.start(a)
a<-table.element(a,'10% type I error level',header=TRUE)
a<-table.element(a,numsignificant10)
a<-table.element(a,numsignificant10/numgqtests)
if (numsignificant10/numgqtests < 0.1) dum <- 'OK' else dum <- 'NOK'
a<-table.element(a,dum)
a<-table.row.end(a)
a<-table.end(a)
table.save(a,file='mytable6.tab')
}