| Multiple Linear Regression - Estimated Regression Equation |
| le[t] = + 70.2519572819284 -0.0234953652984406ppt[t] -0.000432047030747009ppp[t] + e[t] |
| Multiple Linear Regression - Ordinary Least Squares | |||||
| Variable | Parameter | S.D. | T-STAT H0: parameter = 0 | 2-tail p-value | 1-tail p-value |
| (Intercept) | 70.2519572819284 | 1.087705 | 64.5873 | 0 | 0 |
| ppt | -0.0234953652984406 | 0.009647 | -2.4355 | 0.020103 | 0.010051 |
| ppp | -0.000432047030747009 | 0.000202 | -2.1359 | 0.039763 | 0.019882 |
| Multiple Linear Regression - Regression Statistics | |
| Multiple R | 0.663352260036241 |
| R-squared | 0.440036220895189 |
| Adjusted R-squared | 0.408038290660628 |
| F-TEST (value) | 13.7520213860555 |
| F-TEST (DF numerator) | 2 |
| F-TEST (DF denominator) | 35 |
| p-value | 3.91560502785993e-05 |
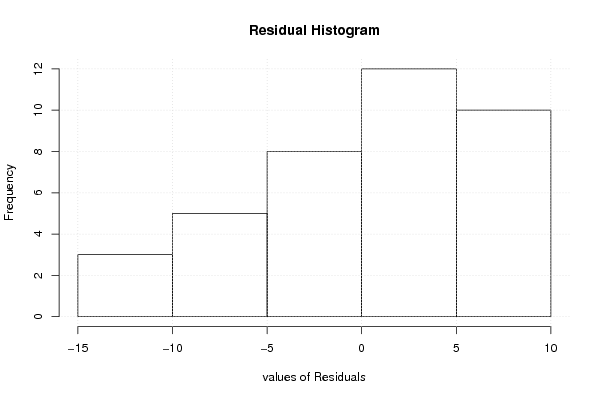
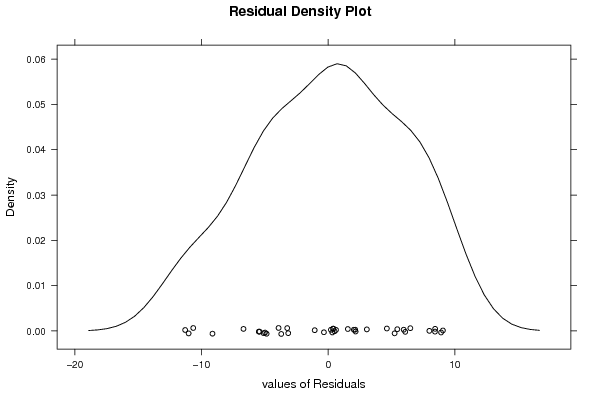
| Multiple Linear Regression - Residual Statistics | |
| Residual Standard Deviation | 6.00296291839995 |
| Sum Squared Residuals | 1261.24473298897 |
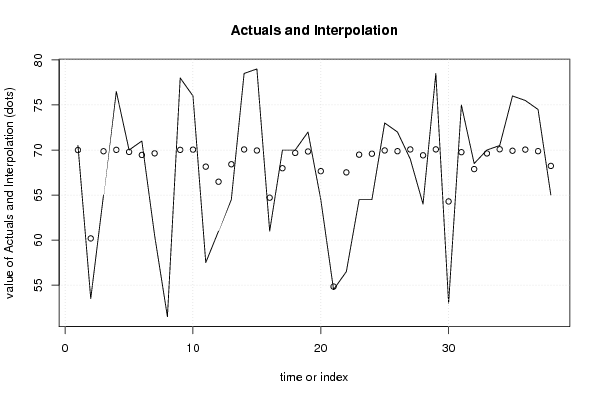
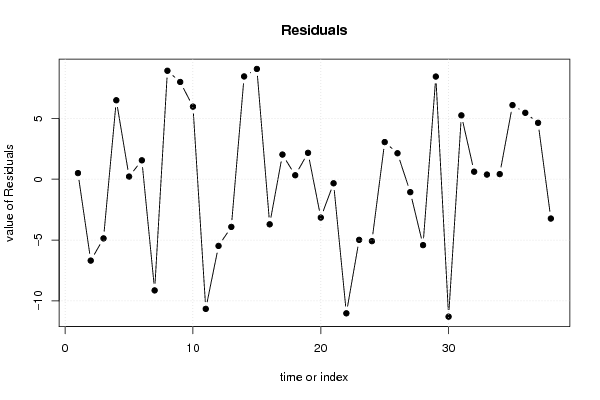
| Multiple Linear Regression - Actuals, Interpolation, and Residuals | |||
| Time or Index | Actuals | Interpolation Forecast | Residuals Prediction Error |
| 1 | 70.5 | 69.9981184193582 | 0.501881580641828 |
| 2 | 53.5 | 60.1869152213336 | -6.68691522133357 |
| 3 | 65 | 69.8624556517037 | -4.86245565170369 |
| 4 | 76.5 | 70.0180260441156 | 6.48197395588435 |
| 5 | 70 | 69.7861881187706 | 0.213811881229445 |
| 6 | 71 | 69.4502782915685 | 1.54972170843147 |
| 7 | 60.5 | 69.6333858315116 | -9.13338583151164 |
| 8 | 51.5 | 42.5949443896275 | 8.90505561037254 |
| 9 | 78 | 70.0167543787614 | 7.98324562123858 |
| 10 | 76 | 70.041381059514 | 5.958618940486 |
| 11 | 57.5 | 68.1505729958212 | -10.6505729958212 |
| 12 | 61 | 66.4792552174078 | -5.4792552174078 |
| 13 | 64.5 | 68.4188791640692 | -3.91887916406922 |
| 14 | 78.5 | 70.0620079356303 | 8.43799206436972 |
| 15 | 79 | 69.9465489826663 | 9.05345101733372 |
| 16 | 61 | 64.7063640741396 | -3.70636407413964 |
| 17 | 70 | 67.9775170036924 | 2.02248299630764 |
| 18 | 70 | 69.6762678571897 | 0.323732142810264 |
| 19 | 72 | 69.8376596525105 | 2.16234034748951 |
| 20 | 64.5 | 67.653189429831 | -3.15318942983098 |
| 21 | 54.5 | 54.8370171230983 | -0.337017123098257 |
| 22 | 56.5 | 67.5154364344563 | -11.0154364344563 |
| 23 | 64.5 | 69.4840623845113 | -4.98406238451128 |
| 24 | 64.5 | 69.5863641206488 | -5.08636412064881 |
| 25 | 73 | 69.9529427825059 | 3.04705721749408 |
| 26 | 72 | 69.8694707999502 | 2.13052920004982 |
| 27 | 69 | 70.0648719320099 | -1.06487193200992 |
| 28 | 64 | 69.4145652424446 | -5.41456524244457 |
| 29 | 78.5 | 70.072056398697 | 8.42794360130297 |
| 30 | 53 | 64.2893736441893 | -11.2893736441893 |
| 31 | 75 | 69.7598467283025 | 5.24015327169747 |
| 32 | 68.5 | 67.8838226125079 | 0.616177387492084 |
| 33 | 70 | 69.620776535878 | 0.37922346412199 |
| 34 | 70.5 | 70.0838285570843 | 0.41617144291574 |
| 35 | 76 | 69.9174904502467 | 6.08250954975334 |
| 36 | 75.5 | 70.0468663066186 | 5.45313369338136 |
| 37 | 74.5 | 69.8715241465469 | 4.62847585345314 |
| 38 | 65 | 68.2329740810809 | -3.23297408108089 |
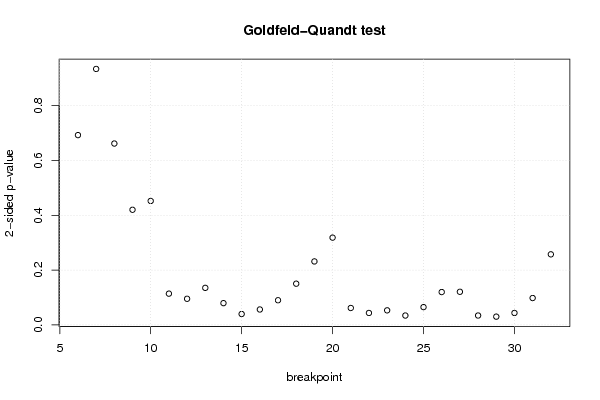
| Goldfeld-Quandt test for Heteroskedasticity | |||
| p-values | Alternative Hypothesis | ||
| breakpoint index | greater | 2-sided | less |
| 6 | 0.346310579046194 | 0.692621158092389 | 0.653689420953806 |
| 7 | 0.532996249625659 | 0.934007500748682 | 0.467003750374341 |
| 8 | 0.669115818608784 | 0.661768362782431 | 0.330884181391216 |
| 9 | 0.7899807829517 | 0.4200384340966 | 0.2100192170483 |
| 10 | 0.773889158162468 | 0.452221683675064 | 0.226110841837532 |
| 11 | 0.943048896365096 | 0.113902207269808 | 0.0569511036349041 |
| 12 | 0.95239059463977 | 0.0952188107204608 | 0.0476094053602304 |
| 13 | 0.932483712155186 | 0.135032575689627 | 0.0675162878448137 |
| 14 | 0.960365052431125 | 0.0792698951377501 | 0.039634947568875 |
| 15 | 0.980217526905587 | 0.039564946188826 | 0.019782473094413 |
| 16 | 0.971963865433766 | 0.0560722691324683 | 0.0280361345662342 |
| 17 | 0.95505384266027 | 0.0898923146794607 | 0.0449461573397303 |
| 18 | 0.92490511970937 | 0.150189760581259 | 0.0750948802906296 |
| 19 | 0.884233716591414 | 0.231532566817172 | 0.115766283408586 |
| 20 | 0.840845811640807 | 0.318308376718386 | 0.159154188359193 |
| 21 | 0.969225277601844 | 0.0615494447963118 | 0.0307747223981559 |
| 22 | 0.978303805720928 | 0.043392388558145 | 0.0216961942790725 |
| 23 | 0.973498623194806 | 0.053002753610388 | 0.026501376805194 |
| 24 | 0.982957714576891 | 0.0340845708462188 | 0.0170422854231094 |
| 25 | 0.967639589319239 | 0.064720821361522 | 0.032360410680761 |
| 26 | 0.940117089163556 | 0.119765821672888 | 0.0598829108364438 |
| 27 | 0.939654305664597 | 0.120691388670805 | 0.0603456943354027 |
| 28 | 0.982948239769014 | 0.0341035204619727 | 0.0170517602309863 |
| 29 | 0.985025755717253 | 0.0299484885654938 | 0.0149742442827469 |
| 30 | 0.97830996274418 | 0.0433800745116404 | 0.0216900372558202 |
| 31 | 0.951065611992526 | 0.0978687760149473 | 0.0489343880074736 |
| 32 | 0.871295237394941 | 0.257409525210119 | 0.128704762605059 |
| Meta Analysis of Goldfeld-Quandt test for Heteroskedasticity | |||
| Description | # significant tests | % significant tests | OK/NOK |
| 1% type I error level | 0 | 0 | OK |
| 5% type I error level | 6 | 0.222222222222222 | NOK |
| 10% type I error level | 14 | 0.518518518518518 | NOK |