| Multiple Linear Regression - Estimated Regression Equation |
| Y_t[t] = + 0.0158598705609327 -0.00379664026461644X_1t[t] + 0.261788999309723X_2t[t] + 0.00183128940147942X_3t[t] -0.00295797398314793X_4t[t] -0.256111822739559X_5t[t] + 0.00494102191102535X_6t[t] -0.014213350366382X_7t[t] + 0.00446533957135378X_8t[t] -0.00943433115097307X_9t[t] + 0.238885433628411X_10t[t] -0.00145084519409482X_11t[t] + 0.240612892049589X_12t[t] -0.00281276409301584t + e[t] |
| Multiple Linear Regression - Ordinary Least Squares | |||||
| Variable | Parameter | S.D. | T-STAT H0: parameter = 0 | 2-tail p-value | 1-tail p-value |
| (Intercept) | 0.0158598705609327 | 1.301586 | 0.0122 | 0.990331 | 0.495165 |
| X_1t | -0.00379664026461644 | 0.011363 | -0.3341 | 0.739804 | 0.369902 |
| X_2t | 0.261788999309723 | 0.016405 | 15.9581 | 0 | 0 |
| X_3t | 0.00183128940147942 | 0.008882 | 0.2062 | 0.837555 | 0.418778 |
| X_4t | -0.00295797398314793 | 0.010088 | -0.2932 | 0.770669 | 0.385335 |
| X_5t | -0.256111822739559 | 0.007685 | -33.326 | 0 | 0 |
| X_6t | 0.00494102191102535 | 0.01422 | 0.3475 | 0.729817 | 0.364909 |
| X_7t | -0.014213350366382 | 0.021581 | -0.6586 | 0.513424 | 0.256712 |
| X_8t | 0.00446533957135378 | 0.034842 | 0.1282 | 0.898582 | 0.449291 |
| X_9t | -0.00943433115097307 | 0.042162 | -0.2238 | 0.823933 | 0.411966 |
| X_10t | 0.238885433628411 | 0.043385 | 5.5061 | 2e-06 | 1e-06 |
| X_11t | -0.00145084519409482 | 0.012426 | -0.1168 | 0.907563 | 0.453781 |
| X_12t | 0.240612892049589 | 0.02312 | 10.4071 | 0 | 0 |
| t | -0.00281276409301584 | 0.005994 | -0.4692 | 0.641112 | 0.320556 |
| Multiple Linear Regression - Regression Statistics | |
| Multiple R | 0.999231404290997 |
| R-squared | 0.99846339932136 |
| Adjusted R-squared | 0.99802914260783 |
| F-TEST (value) | 2299.24689294314 |
| F-TEST (DF numerator) | 13 |
| F-TEST (DF denominator) | 46 |
| p-value | 0 |
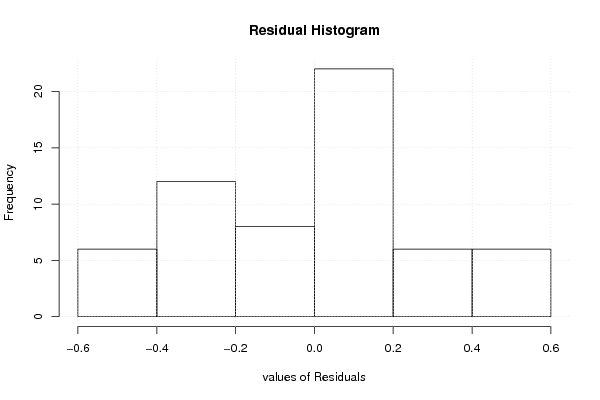
| Multiple Linear Regression - Residual Statistics | |
| Residual Standard Deviation | 0.327670177865718 |
| Sum Squared Residuals | 4.93891629127736 |
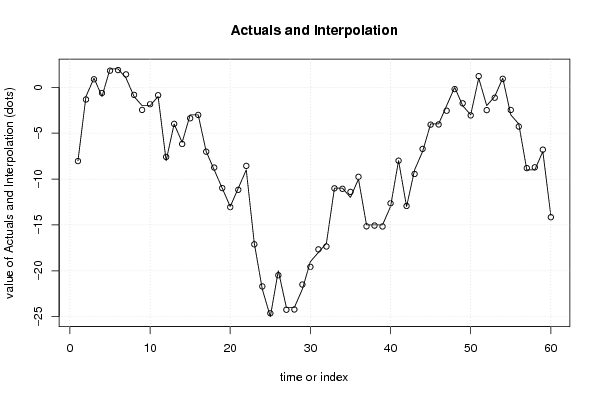
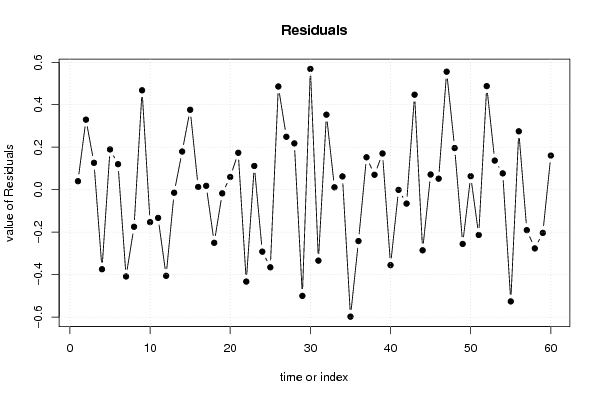
| Multiple Linear Regression - Actuals, Interpolation, and Residuals | |||
| Time or Index | Actuals | Interpolation Forecast | Residuals Prediction Error |
| 1 | -8 | -8.03988935699105 | 0.0398893569910541 |
| 2 | -1 | -1.32979162207042 | 0.329791622070419 |
| 3 | 1 | 0.873638055575794 | 0.126361944424206 |
| 4 | -1 | -0.62530507106509 | -0.37469492893491 |
| 5 | 2 | 1.81045927746166 | 0.189540722538337 |
| 6 | 2 | 1.87993884416919 | 0.120061155830815 |
| 7 | 1 | 1.40863085304116 | -0.408630853041161 |
| 8 | -1 | -0.825335710734479 | -0.174664289265521 |
| 9 | -2 | -2.46794465210392 | 0.467944652103924 |
| 10 | -2 | -1.8471005870932 | -0.152899412906796 |
| 11 | -1 | -0.86703035781681 | -0.13296964218319 |
| 12 | -8 | -7.59424444948332 | -0.405755550516684 |
| 13 | -4 | -3.98561340897042 | -0.0143865910295756 |
| 14 | -6 | -6.17961055752408 | 0.179610557524077 |
| 15 | -3 | -3.37623242865594 | 0.376232428655942 |
| 16 | -3 | -3.0126443942703 | 0.0126443942703027 |
| 17 | -7 | -7.01809888257546 | 0.0180988825754634 |
| 18 | -9 | -8.74978413442691 | -0.250215865573086 |
| 19 | -11 | -10.9826120383344 | -0.0173879616656274 |
| 20 | -13 | -13.0597010744391 | 0.0597010744391143 |
| 21 | -11 | -11.1736337256083 | 0.173633725608331 |
| 22 | -9 | -8.56714548396922 | -0.432854516030781 |
| 23 | -17 | -17.1116256255954 | 0.111625625595427 |
| 24 | -22 | -21.7081700540606 | -0.291829945939377 |
| 25 | -25 | -24.6344503989929 | -0.365549601007143 |
| 26 | -20 | -20.4859726415844 | 0.485972641584384 |
| 27 | -24 | -24.2491153725968 | 0.249115372596772 |
| 28 | -24 | -24.2179617107419 | 0.217961710741883 |
| 29 | -22 | -21.4998538501846 | -0.500146149815409 |
| 30 | -19 | -19.5685429137242 | 0.568542913724238 |
| 31 | -18 | -17.6658486368572 | -0.334151363142822 |
| 32 | -17 | -17.3531866531479 | 0.353186653147878 |
| 33 | -11 | -11.0111483486613 | 0.0111483486612717 |
| 34 | -11 | -11.062362330699 | 0.0623623306989778 |
| 35 | -12 | -11.4020175170614 | -0.597982482938563 |
| 36 | -10 | -9.75796208803816 | -0.24203791196184 |
| 37 | -15 | -15.152481654661 | 0.152481654661003 |
| 38 | -15 | -15.0702237895864 | 0.0702237895864127 |
| 39 | -15 | -15.1703810063484 | 0.170381006348366 |
| 40 | -13 | -12.6445832816141 | -0.355416718385876 |
| 41 | -8 | -7.99904388567119 | -0.00095611432881003 |
| 42 | -13 | -12.934487800119 | -0.0655121998809815 |
| 43 | -9 | -9.4473342683289 | 0.447334268328906 |
| 44 | -7 | -6.71439947042818 | -0.285600529571819 |
| 45 | -4 | -4.07142417924703 | 0.0714241792470265 |
| 46 | -4 | -4.05192169573835 | 0.0519216957383479 |
| 47 | -2 | -2.55565638889264 | 0.555656388892642 |
| 48 | 0 | -0.196079684820424 | 0.196079684820424 |
| 49 | -2 | -1.74447618632881 | -0.255523813671191 |
| 50 | -3 | -3.06347242847346 | 0.0634724284734565 |
| 51 | 1 | 1.21336278591619 | -0.213362785916192 |
| 52 | -2 | -2.48767533802754 | 0.487675338027539 |
| 53 | -1 | -1.13705545480072 | 0.137055454800717 |
| 54 | 1 | 0.923290110169085 | 0.0767098898309148 |
| 55 | -3 | -2.47380333946715 | -0.526196660532851 |
| 56 | -4 | -4.27483859382454 | 0.27483859382454 |
| 57 | -9 | -8.80938154340936 | -0.19061845659064 |
| 58 | -9 | -8.72348554830976 | -0.276514451690237 |
| 59 | -7 | -6.7965330941959 | -0.203466905804099 |
| 60 | -14 | -14.1606452159621 | 0.160645215962069 |
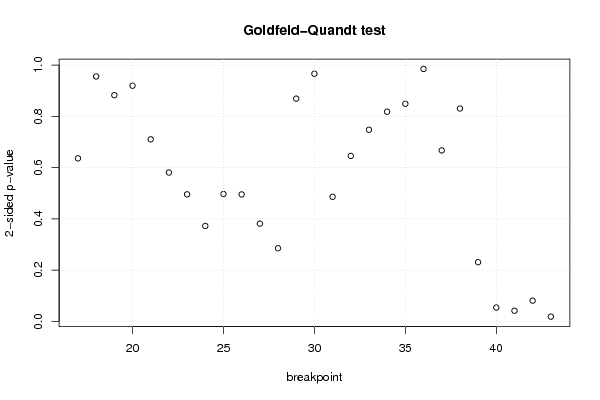
| Goldfeld-Quandt test for Heteroskedasticity | |||
| p-values | Alternative Hypothesis | ||
| breakpoint index | greater | 2-sided | less |
| 17 | 0.681901367076116 | 0.636197265847769 | 0.318098632923884 |
| 18 | 0.522199405422578 | 0.955601189154844 | 0.477800594577422 |
| 19 | 0.558707006430139 | 0.882585987139723 | 0.441292993569861 |
| 20 | 0.459677982515803 | 0.919355965031605 | 0.540322017484197 |
| 21 | 0.355130123169635 | 0.71026024633927 | 0.644869876830365 |
| 22 | 0.290302160590423 | 0.580604321180845 | 0.709697839409577 |
| 23 | 0.247836383633752 | 0.495672767267503 | 0.752163616366248 |
| 24 | 0.186189542705979 | 0.372379085411958 | 0.813810457294021 |
| 25 | 0.248485399406259 | 0.496970798812519 | 0.751514600593741 |
| 26 | 0.247697905340103 | 0.495395810680206 | 0.752302094659897 |
| 27 | 0.190730281438267 | 0.381460562876534 | 0.809269718561733 |
| 28 | 0.14264607580827 | 0.285292151616539 | 0.85735392419173 |
| 29 | 0.434507470164972 | 0.869014940329944 | 0.565492529835028 |
| 30 | 0.483023525965023 | 0.966047051930046 | 0.516976474034977 |
| 31 | 0.756986817000513 | 0.486026365998974 | 0.243013182999487 |
| 32 | 0.677186564244984 | 0.645626871510032 | 0.322813435755016 |
| 33 | 0.626181154674774 | 0.747637690650451 | 0.373818845325226 |
| 34 | 0.5909602180726 | 0.8180795638548 | 0.4090397819274 |
| 35 | 0.575509033260457 | 0.848981933479087 | 0.424490966739543 |
| 36 | 0.507587773898278 | 0.984824452203445 | 0.492412226101722 |
| 37 | 0.666461105941357 | 0.667077788117286 | 0.333538894058643 |
| 38 | 0.584763894067212 | 0.830472211865575 | 0.415236105932788 |
| 39 | 0.884502488457236 | 0.230995023085529 | 0.115497511542764 |
| 40 | 0.97296336551666 | 0.0540732689666816 | 0.0270366344833408 |
| 41 | 0.979209760755066 | 0.0415804784898673 | 0.0207902392449336 |
| 42 | 0.959482936697658 | 0.081034126604684 | 0.040517063302342 |
| 43 | 0.990711248736035 | 0.0185775025279301 | 0.00928875126396504 |
| Meta Analysis of Goldfeld-Quandt test for Heteroskedasticity | |||
| Description | # significant tests | % significant tests | OK/NOK |
| 1% type I error level | 0 | 0 | OK |
| 5% type I error level | 2 | 0.0740740740740741 | NOK |
| 10% type I error level | 4 | 0.148148148148148 | NOK |